Introduction: A Century of Lessons
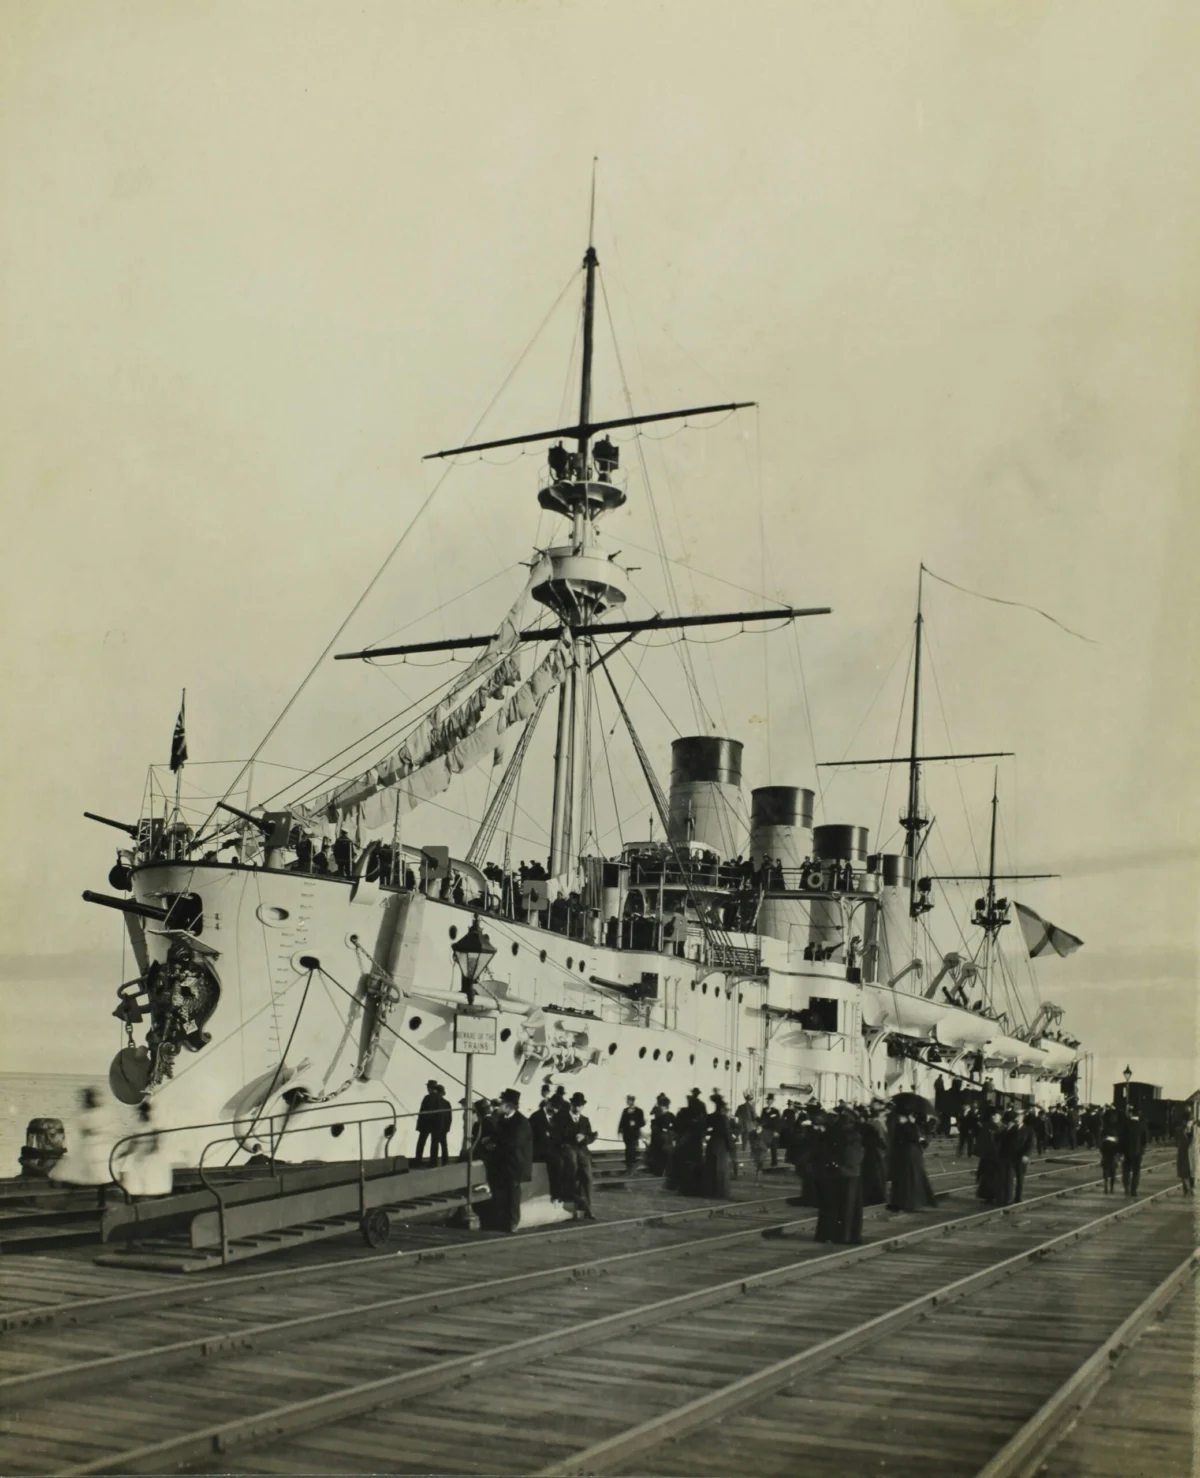
The sinking of the RMS Titanic on April 15, 1912, remains perhaps the most scrutinized maritime disaster in history. Beyond the tragic loss of 1,502 lives, the event serves as a grim laboratory for human behavior under extreme duress. What was promised to be an unsinkable marvel of Edwardian engineering became a catalyst for global changes in maritime safety regulations, class awareness, and disaster management.
Over a century later, the "Titanic" dataset—a foundational pillar of data science—allows us to move beyond the mythology and examine the cold, hard statistics of survival. By applying modern analytical tools to historical records, we can strip away the romanticized narratives and uncover the uncomfortable truths about how social status, demographics, and family structures dictated the fate of those aboard.

Chronology of the Tragedy
To understand the data, one must first understand the timeline of the catastrophe.
- April 10, 1912: The RMS Titanic departs Southampton, England, on its maiden voyage, commanded by Captain Edward John Smith. Carrying over 2,200 passengers and crew, it represented the zenith of luxury and industrial hubris.
- April 14, 1912 (The Warning): Throughout the day, the bridge received numerous reports of ice fields in the North Atlantic. Despite these warnings, the ship maintained a high speed.
- 11:40 PM: The lookout spots an iceberg. Despite efforts to steer clear, the ship grazes the ice, causing fatal damage to its hull plates.
- April 15, 1912 (The Sinking): As the ship began to list, radio distress signals were sent out. While the RMS Carpathia eventually arrived to rescue survivors, the reality of the evacuation was grim. The "women and children first" protocol was applied inconsistently, and the sheer lack of lifeboats meant that the majority of the ship’s population was left to the mercy of the freezing Atlantic.
The Analytical Framework: Why Data Matters
The Titanic dataset is widely regarded as the "Hello World" of data science. Its beauty lies in the fact that it is not merely a collection of numbers; it is a ledger of human lives. By using Python libraries—specifically Pandas for data manipulation and Matplotlib/Seaborn for visualization—we can move from subjective storytelling to objective pattern recognition.

Loading and Preparing the Data
To begin our investigation, we utilize the Pandas library to load the dataset. This allows us to interact with the passenger list as a structured DataFrame.
import pandas as pd
import seaborn as sns
import matplotlib.pyplot as plt

# Loading the dataset
url = "https://raw.githubusercontent.com/datasciencedojo/datasets/master/titanic.csv"
df = pd.read_csv(url)
By inspecting the data, we identify key attributes: Survived (the target variable), Pclass (socio-economic status), Sex, Age, SibSp (siblings/spouses), and Parch (parents/children).

Supporting Data: Dissecting the Survival Odds
1. The Gender Divide
The social protocols of 1912 dictated that women should be given priority during the loading of lifeboats. Our analysis confirms this: women experienced a 74% survival rate, compared to a mere 18% for men. This stark disparity is the most statistically significant variable in the entire dataset, suggesting that the "chivalry" of the era was indeed a primary driver of life-saving outcomes.
2. The Influence of Socio-Economic Status (Pclass)
Survival was not a democratic process. The dataset reveals a linear correlation between wealth and survival:

- 1st Class: ~62% survival rate.
- 2nd Class: ~47% survival rate.
- 3rd Class: ~24% survival rate.
The data suggests that the layout of the ship played a critical role. First-class cabins were closer to the boat deck, and the social standing of these passengers likely granted them earlier access to the limited number of lifeboats.
3. Age and the "Children First" Protocol
Did the priority extend to the youth? Our analysis of children (under 16) confirms that 59% survived, compared to the much lower rates of the adult population. However, the data also shows that young adults were the most vulnerable group, likely due to their role in assisting others or their inability to secure passage on the early, less crowded lifeboats.

4. Family Dynamics
An interesting pattern emerges when examining FamilySize. Passengers traveling with a moderate number of family members (2 to 4) had higher survival rates than those traveling alone or in very large groups. This suggests a survival "sweet spot": single travelers may have lacked a support system to navigate the chaotic evacuation, while very large families may have been slowed down by the logistics of moving as a group.
Official Responses and Maritime Reform
The outcry following the disaster was immediate. The sinking of the Titanic forced a radical overhaul of maritime safety laws. The International Convention for the Safety of Life at Sea (SOLAS) was established in 1914, mandating that:

- Lifeboat capacity must be sufficient for every person on board.
- Radio watches must be maintained 24 hours a day on all passenger ships.
- Rigorous iceberg patrolling was instituted in the North Atlantic.
The tragedy shifted the global perspective from viewing ships as self-contained, invincible fortresses to viewing them as vulnerable vessels requiring constant, regulated vigilance.
Implications: The Intersection of Data and Ethics
What does this analysis teach us? It forces us to confront the reality that, in times of crisis, systemic factors—class, gender, and family structure—often outweigh individual agency.

When we combine these factors into a "High Survival Group" (female, 1st class, moderate family size), we see a clear stratification of who lived and who perished. This isn’t just a historical curiosity; it is a lesson in how institutional design shapes the outcome of disasters. In modern urban planning, emergency management, and resource distribution, we still grapple with these same variables. Are our evacuation protocols accessible to the most vulnerable? Do we prioritize based on status or on need?
Conclusion
The Titanic dataset is more than a tool for practicing Python. It is a digital archive of a profound human tragedy. Through the lens of data analytics, we have seen that the "unsinkable" ship fell prey not just to an iceberg, but to the rigid social structures of the early 20th century.

As we conclude this exploration, we realize that data does not just tell us what happened; it tells us why it happened. By mastering these analytical techniques, we gain the ability to look at any complex system—be it a ship, a company, or a society—and understand the invisible forces that determine survival and success. The lessons of the Titanic continue to float, not just in the cold waters of the Atlantic, but in the rows and columns of the data that keeps the memory of its passengers alive.