
 Layla Zulfa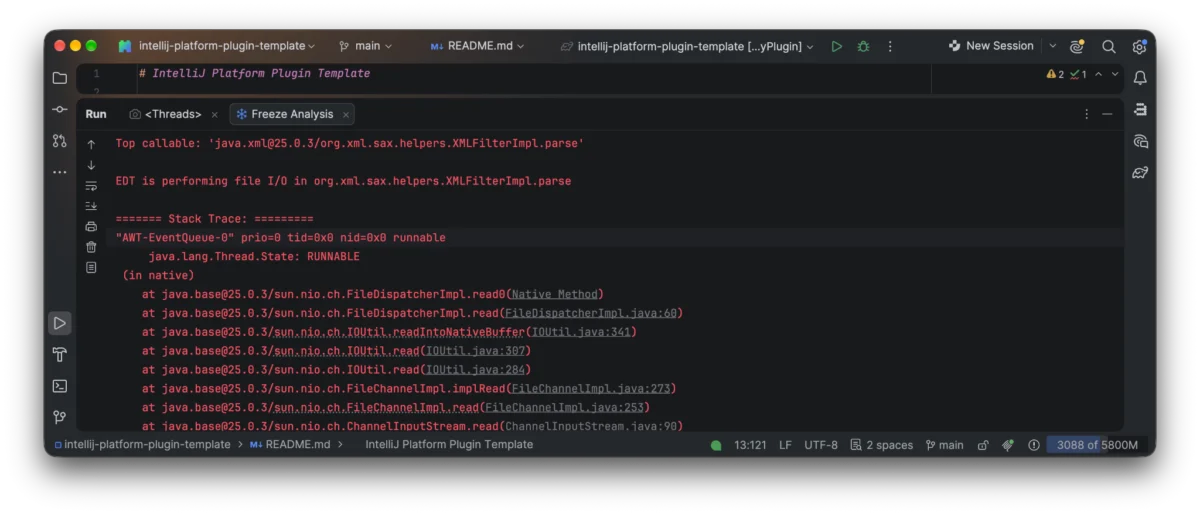
For plugin developers, few things are as frustrating as the “Heisenbug”—a performance issue reported by a user that simply refuses to manifest in a local development environment. When a user reports that the IDE has stopped responding, the developer is often left grasping at straws. Was it a memory leak? A deadlock in a background thread? Or perhaps a simple case of blocking the Event Dispatch Thread (EDT) with an I/O operation?
Without concrete diagnostic data, such as a thread dump captured during the exact moment of a freeze, investigating these reports is a process of blind guesswork. Recognizing this critical pain point, JetBrains has introduced a sophisticated new suite of diagnostic tools within the JetBrains Marketplace, designed to empower developers to move from guesswork to precision engineering.
The Core Challenge: Why IDE Freezes Remain Elusive
The IntelliJ Platform relies on a highly concurrent architecture. At its heart lies the Event Dispatch Thread (EDT), responsible for processing UI events and rendering the interface. When the EDT becomes blocked—whether by heavy computation, synchronous file I/O, or waiting for a contended lock—the IDE ceases to respond, resulting in the dreaded "UI Freeze."

Historically, plugin authors relied on users to manually export and attach thread dumps, a process that was both cumbersome for the user and prone to data loss. Today, JetBrains Marketplace bridges this gap by automatically attributing UI freeze reports to specific plugins. By centralizing this data, the platform transforms sporadic user complaints into a structured, actionable stream of telemetry.
Chronology: From Reporting to Resolution
To effectively leverage these new capabilities, developers should follow a structured diagnostic workflow:
- Enablement: The process begins with the plugin author proactively enabling Marketplace reporting in the
plugin.xmlconfiguration file. Without this integration, the diagnostic pipeline remains dormant. - Collection: When a user experiences a freeze while your plugin is active, the IDE captures a series of thread dumps, typically sampled every five seconds. These are aggregated and uploaded to the Marketplace.
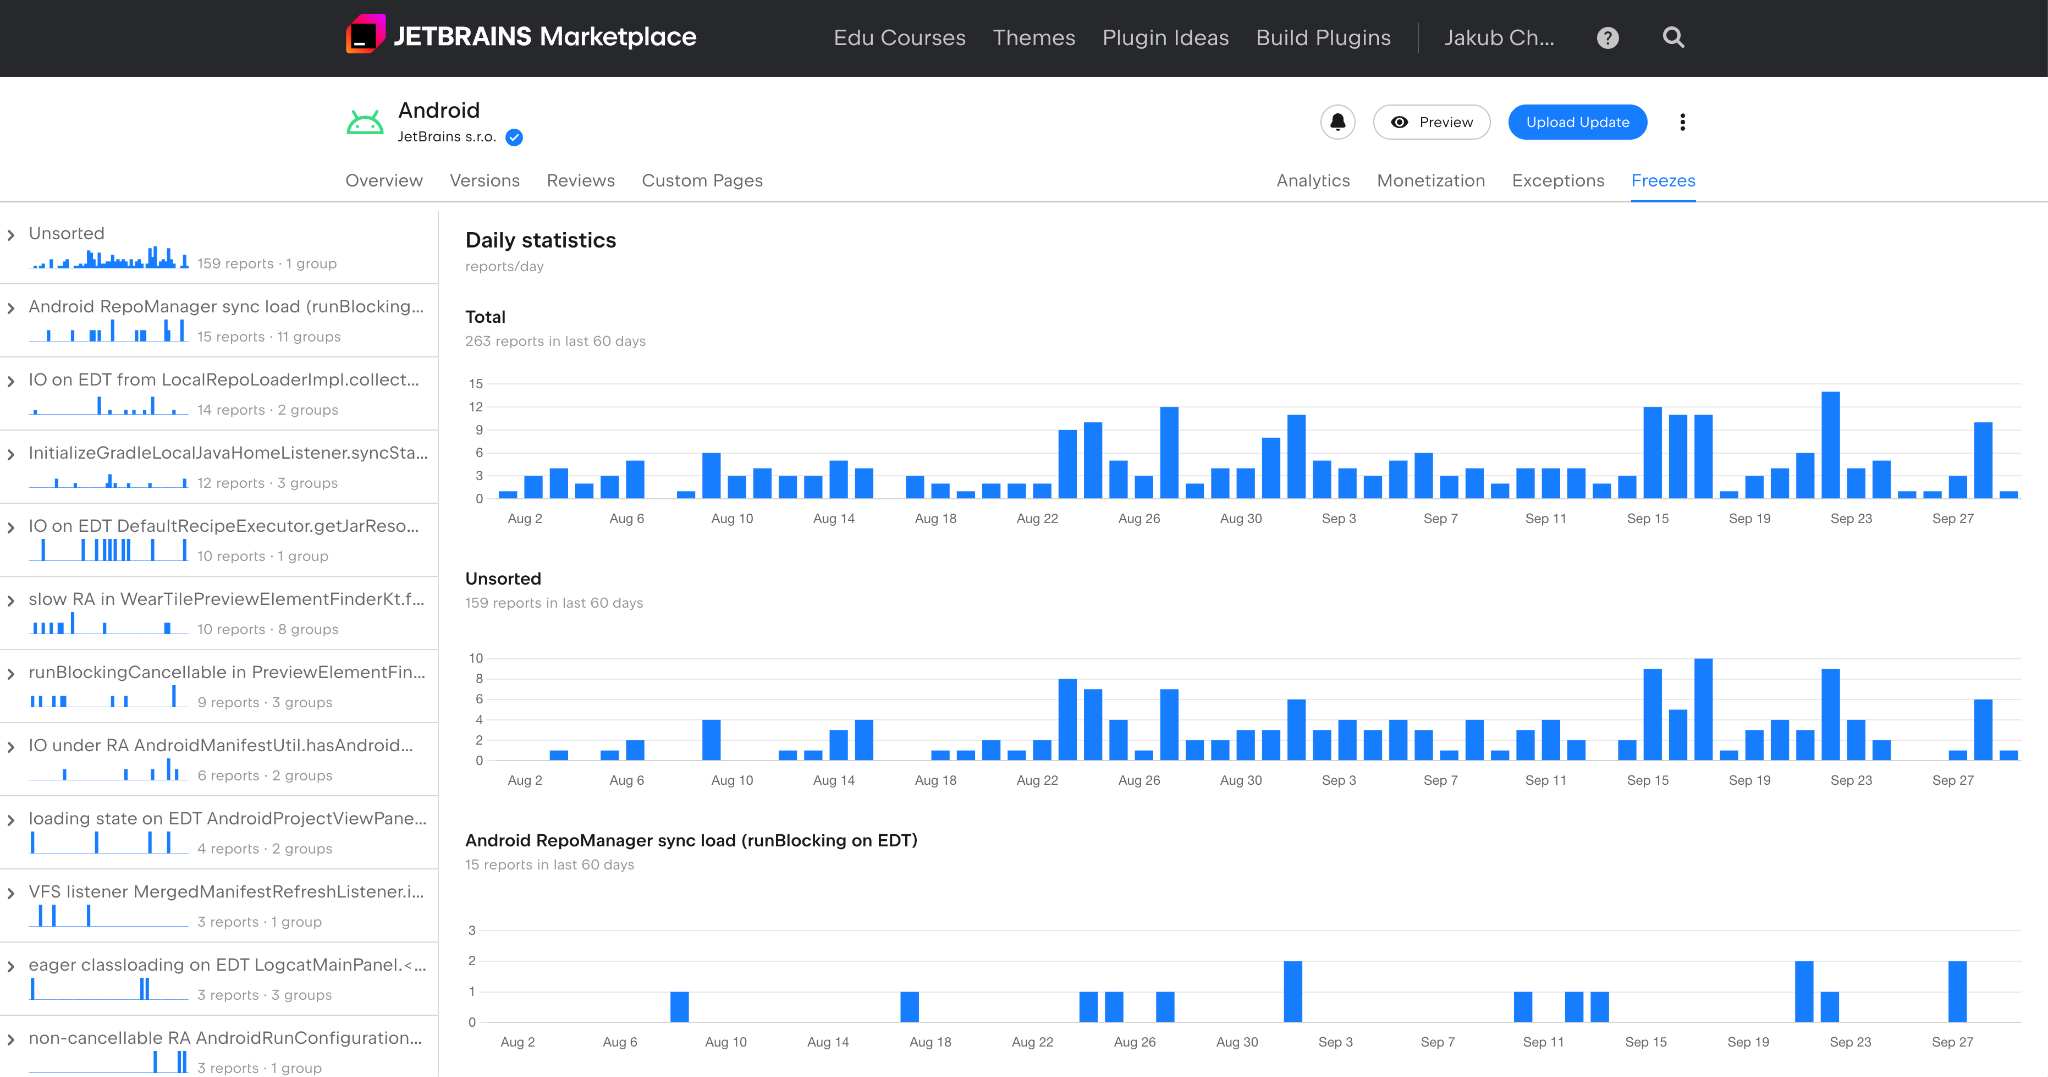
- Aggregation: Marketplace employs a "pile" system, grouping similar freeze reports by error type. This prevents developers from being overwhelmed by individual logs, highlighting recurring patterns instead.
- Analysis: The developer accesses the Freezes tab in their plugin’s management page, utilizes the thread-dump excerpts, and, if necessary, employs AI-driven analysis tools to pinpoint the culprit.
- Validation: Once a potential fix is identified, the developer validates the change by reproducing the environment or monitoring future diagnostic reports.
Understanding the Freeze Report: Supporting Data
A freeze report is not merely a wall of text; it is a surgical tool. The reports are categorized into "piles," allowing developers to see the prevalence of a specific issue.

The Anatomy of a Dump
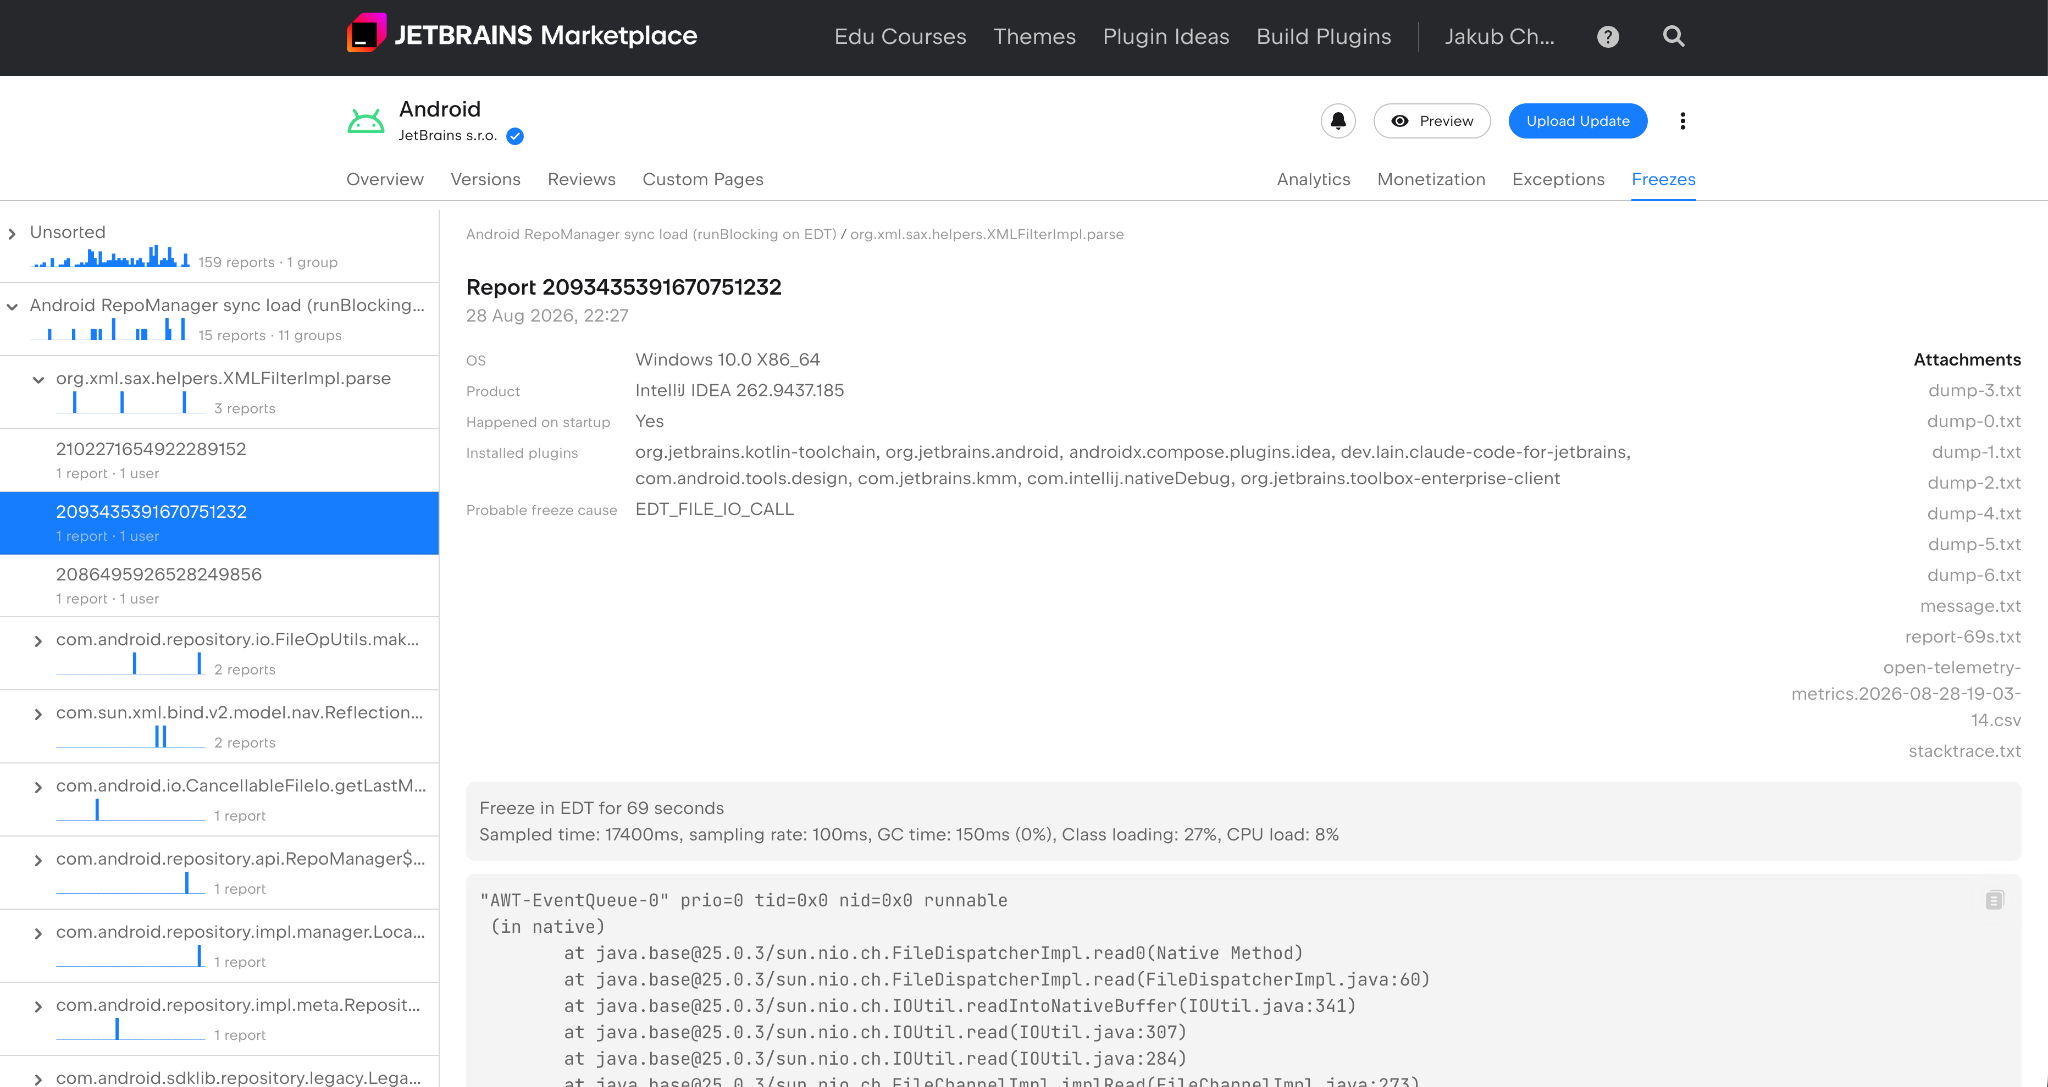
Each report contains two critical components:
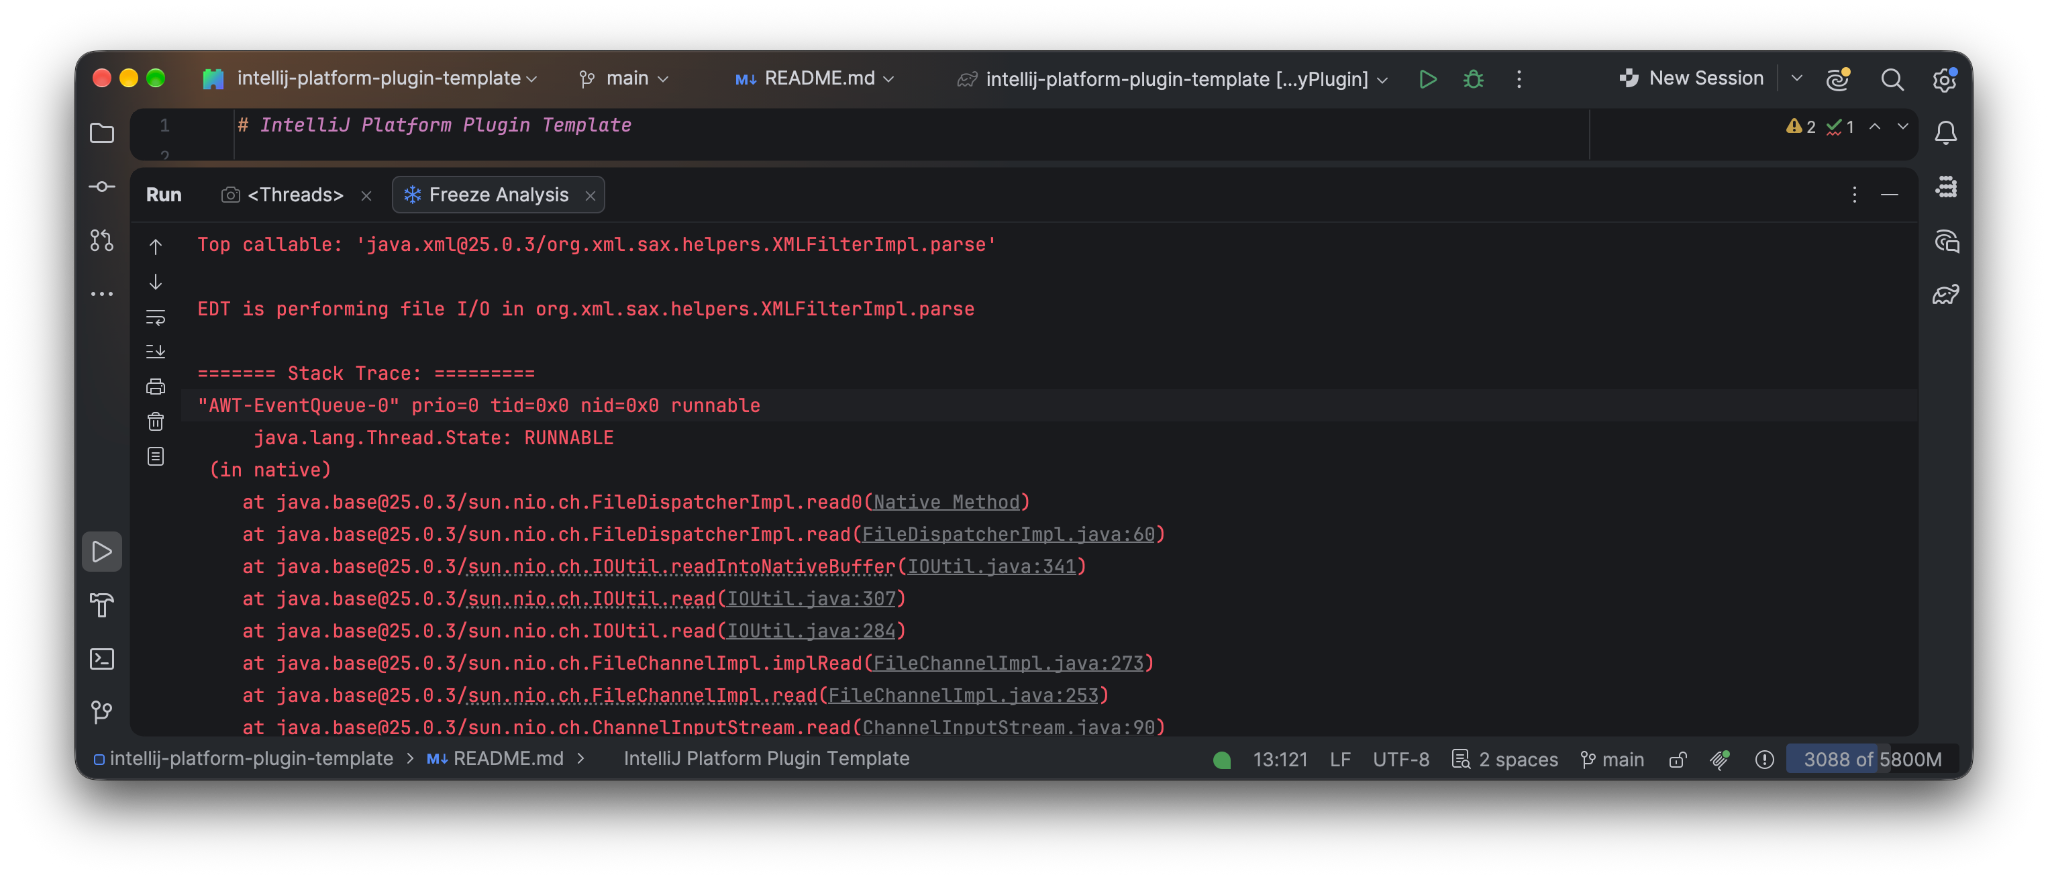
- The Excerpt: A concise summary of the threads involved, particularly the EDT (
AWT-EventQueue-0). This is the ideal starting point for developers and AI agents alike. - The Full Dumps (
dump-N.txt): These provide the deep-dive evidence. By analyzing the stack traces across multiple samples, developers can determine if a process is hanging indefinitely or merely suffering from a temporary bottleneck.
The Role of AI in Debugging
Modern diagnostic efforts are increasingly augmented by AI coding agents. To streamline this, experts like Patrick Scheibe have developed the analyze-freeze skill. This tool is designed to guide agents through the nuances of the IntelliJ Platform—such as Dispatchers.Default starvation or coroutine contention. By feeding the thread-dump excerpt into an AI agent, developers can quickly receive an analysis of the thread state, the code frame responsible, and a prioritized list of hypotheses.
Official Guidelines: Implementing Error Reporting
To ensure your plugin is ready to capture these insights, you must register the error handler. This is a mandatory step for any plugin author looking to improve the stability of their extension.
Configuration
Update your plugin.xml as follows:
<extensions defaultExtensionNs="com.intellij">
    <errorHandler implementation="com.intellij.diagnostic.JetBrainsMarketplaceErrorReportSubmitter"/>
</extensions>
This handler, available since IntelliJ Platform 2023.3, requires no custom code. It is essential to note that for plugins utilizing Split Mode, you must register the handler in both the frontend and shared modules. A backend-only registration will fail to capture UI-related freezes occurring on the frontend.
Implications for Plugin Development
The introduction of these tools signifies a shift in the IntelliJ ecosystem toward "Performance-First" development.
Shifting Paradigms
- The Danger of Blocking I/O: The most common cause of freezes remains performing file or network I/O on the EDT. Even if an operation seems fast, it can block the UI for hundreds of milliseconds, resulting in a perceptible stutter or a total freeze.
- Non-Cancellable Read Actions: Background threads that hold locks required by the EDT can cause cascading failures. Developers must familiarize themselves with the dangers of non-cancellable read actions, ensuring that background tasks can be aborted when the IDE needs to reclaim resources.
- Data Sensitivity: While these tools are powerful, they require a professional approach to privacy. Before sharing diagnostic dumps with third-party AI services, developers must ensure compliance with their organization’s data handling policies. Always verify the findings against the raw source code.
Managing Versioning and Obfuscation
A common pitfall in analyzing reports is failing to correlate the dump with the correct plugin version. If a report lacks version metadata, avoid the temptation to assume it pertains to your latest release. Treat these reports as "unknown" to avoid applying fixes to code that may have already been refactored or removed.
Expert Best Practices for Investigation
When you sit down to investigate a report, follow this professional methodology:
- Start with the EDT: Identify the
AWT-EventQueue-0thread. Is it waiting for a lock? Is it stuck in a loop? Use the Analyze Stack Trace tool within the IDE to visualize the flow. - Trace the Dependency: If the EDT is waiting, find the thread that holds the lock. Follow the stack trace back to your plugin’s code.
- Compare Dumps: By comparing multiple
dump-N.txtfiles, you can identify if the hang is persistent. If the stack trace remains static across all samples, you have found a definitive bottleneck. - Collaborate: If the diagnostic data is inconclusive, do not hesitate to reach out to the JetBrains Platform Forum. Provide the IDE build, your plugin version, and the evidence you have collected. Clear, data-backed questions lead to faster, more accurate support.
Conclusion: A New Era of Stability
The ability to access and analyze UI freeze reports directly through the Marketplace is a milestone for the IntelliJ ecosystem. It democratizes high-level diagnostic capabilities, allowing independent developers to maintain the same level of software reliability as enterprise teams.
By enabling the Marketplace error handler today, you are not just preparing for future bugs; you are building a data-driven foundation that ensures your plugin remains a robust, performant companion for developers worldwide. The next time a user reports a freeze, you will no longer be flying blind—you will have the exact diagnostic trail needed to solve the problem and ship a better, faster, and more stable plugin.

 Nila Kartika Wati
 Neng Nana
 Basiran

 Iffa Jayyana
 Raul Delapena Setiawan
 Rifan Muazin
 Asro
Asro