
 Asep Darmawan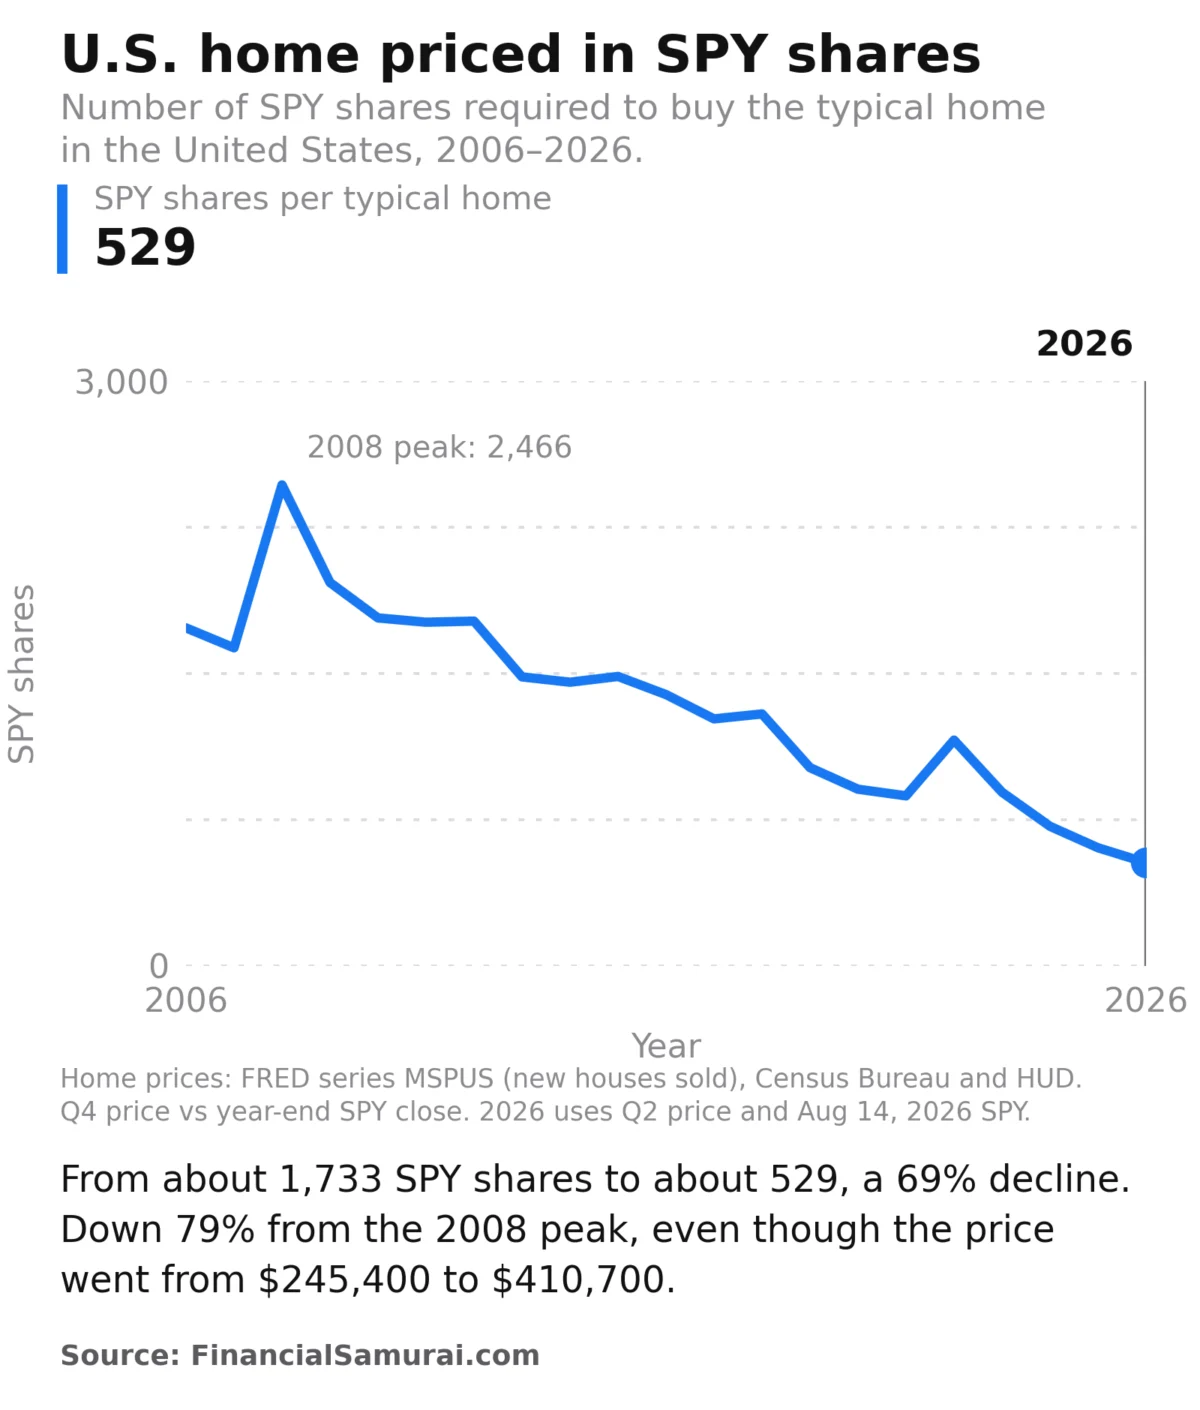
For years, the headlines have remained grim, repetitive, and deeply discouraging: "Housing Affordability Hits Historic Low." Every morning, potential homebuyers wake up to reports that median home prices have eclipsed the purchasing power of the average American household. The narrative suggests a binary outcome: either incomes must skyrocket to meet the current market, or home prices must undergo a catastrophic, market-clearing crash to return to pre-pandemic levels of accessibility.
However, this traditional analysis relies on a flawed premise—it measures the value of a home solely in "dollars earned." By viewing housing through the narrow lens of stagnant median wages, we miss the fundamental shift in how wealth is actually being deployed in the modern real estate market. When we shift the metric from "income" to "invested capital"—specifically, how many shares of a liquid, high-performing stock portfolio it takes to secure a home—the housing crisis looks drastically different.
The Paradigm Shift: Measuring Homes in Shares, Not Dollars
The standard affordability index fails because it ignores the reality of the modern buyer. For a significant portion of the home-buying class, the down payment is not sourced from a savings account tethered to a paycheck; it is harvested from the growth of taxable investment portfolios.
When we measure the cost of a home in shares of the NASDAQ (QQQ) or the S&P 500 (SPY), the "crisis" narrative begins to dissolve. In this framework, we see that the real cost of housing has not risen for the investor class; in many ways, it has collapsed.
The San Francisco Case Study
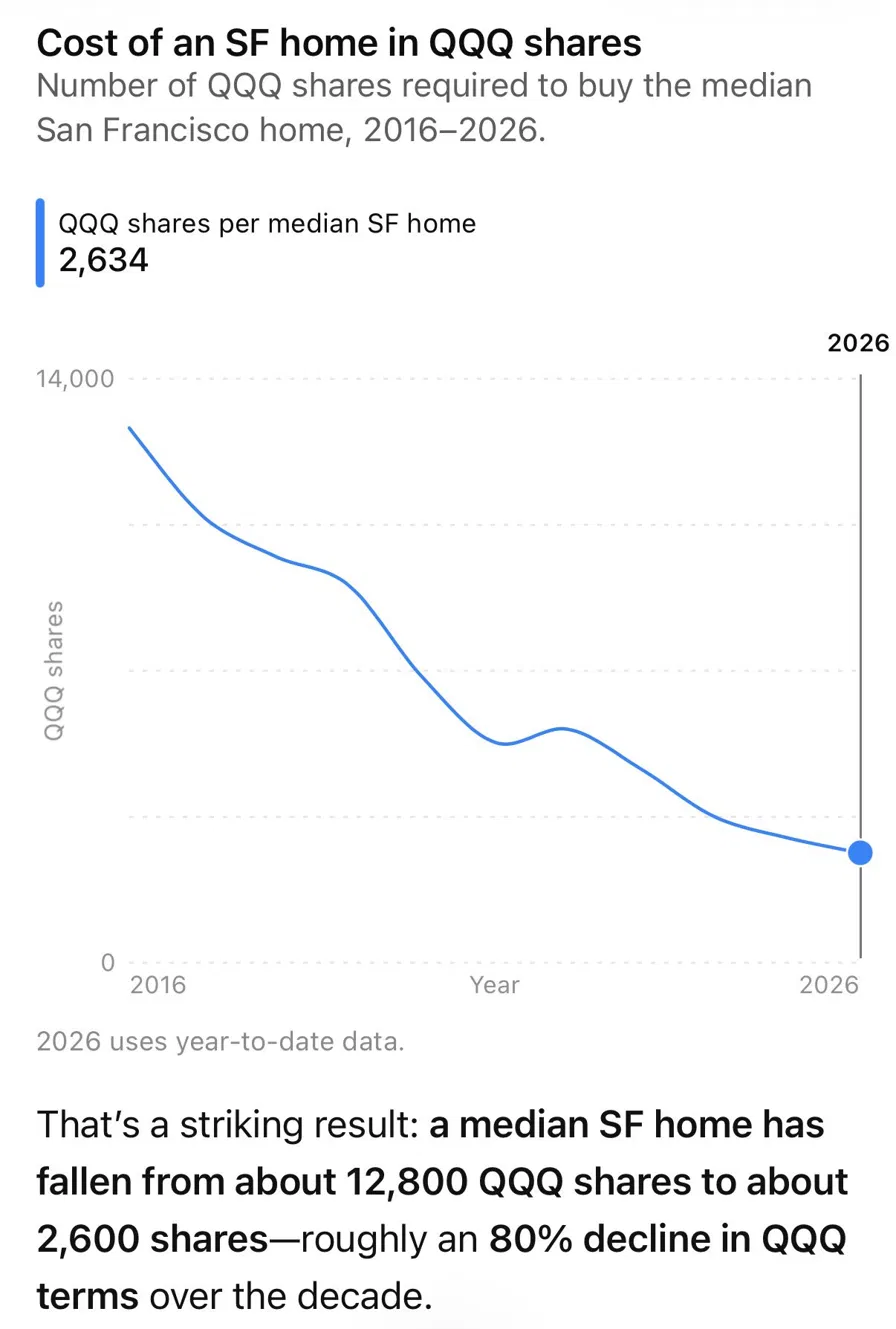
San Francisco is often cited as the ultimate barometer for American housing unaffordability. Yet, when analyzed through the lens of stock-based purchasing power, the "expensive" label becomes debatable. In 2016, acquiring a median San Francisco home required approximately 12,800 shares of QQQ. Ten years later, in 2026, that same median home could be secured for roughly 2,634 shares.
This represents an 80% decline in the "share cost" of a home. While critics might argue that few possess such massive holdings, the principle of the "wealth effect" remains potent. Even if a buyer only requires 20% of the total price for a down payment, the appreciation of their portfolio has vastly outpaced the appreciation of the real estate market.
Chronology of a Disconnected Market
The divergence between home prices and stock market performance is not a recent phenomenon. To understand how we arrived here, we must look at the last two decades of market history.

- 2006–2008 (The Pre-Crash Peak): At the height of the housing bubble in 2006, it required roughly 1,733 shares of SPY to purchase the median American home. As the S&P 500 plummeted during the 2008 financial crisis—losing 38% of its value in a single year—housing prices corrected by only 10% to 15%.
- 2009–2019 (The Recovery Era): During the long bull market, the S&P 500 significantly outperformed the national real estate market. Investors who maintained a consistent contribution strategy to index funds found their purchasing power regarding real estate growing exponentially.
- 2020–2026 (The Post-Pandemic Divergence): Despite the inflationary pressure on home prices, the sustained growth of the stock market has continued to suppress the "real cost" of housing for those with diversified portfolios. Today, the median American home costs roughly 529 shares of SPY—a 69% decrease in required share count compared to 2006.
Supporting Data: Why the "Affordability" Gap Persists
The dissonance between the perceived housing crisis and the reality for investors is best explained by the concept of the "bidder pool." Housing affordability indices often look at the median household income, but the housing market is not priced by the median earner; it is priced by the marginal buyer.
If the buyers actively bidding on homes are those with significant stock market exposure, the "price" of a home is inherently tied to the valuation of the S&P 500. This is why prices have not crashed: the people buying homes are wealthier, on average, than the general population.
The Shrinking Footprint
It is vital to note a nuance in the FRED (Federal Reserve Economic Data) series for new home sales. Homebuilders have spent the last four years actively reducing the square footage of new homes. By shrinking the product, builders have managed to hit specific price points that keep homes "affordable" for a specific segment of the market. Thus, while the price-per-share has plummeted, the underlying asset (the house) has undergone a qualitative change.
Implications for Future Homeowners
For the aspiring homeowner, the implications are clear: the most effective strategy for homeownership is to build a taxable investment portfolio that mirrors the cost of your target home.
The "Target Portfolio" Strategy
If your goal is to purchase an $800,000 home, your primary financial objective should be the creation of an $800,000 taxable portfolio, independent of your retirement accounts (401k/IRA). While this may seem daunting, it provides the "optionality" that transforms a stressful transaction into a strategic maneuver.
By building a portfolio equal to the home’s value, you gain three distinct advantages:
- The Cash Discount: Paying all-cash often removes the need for financing contingencies, allowing for a faster, more competitive close in high-demand markets.
- Strategic Leverage: You retain the choice to either pay cash or use a mortgage, depending on the interest rate environment and your tax situation.
- The Wealth Buffer: If your dream home costs 30% or less of your total net worth, you insulate yourself from the stress and resentment that often follow a "house-poor" financial decision.
The Counter-Argument: The "Racing Target" Risk
No investment strategy is without peril. The primary risk of relying on a stock-heavy "house fund" is volatility. The year 2022 serves as a sobering reminder: the S&P 500 declined by 18% while home prices continued to climb. For an investor whose down payment was held entirely in equities, their target became significantly more expensive just as their capital base contracted.
This creates a "racing target" effect. If your house fund sits entirely in the stock market, a single bad year can set your timeline back by three good years.
Diversification as a Necessity
This is the strongest argument for owning real estate while you save to own real estate. By diversifying into real estate investment vehicles—such as REITs or platforms like Fundrise—you gain exposure to the housing market’s performance without the headache of property management, maintenance, or high-interest debt. This "parallel growth" ensures that if the housing market rallies, your net worth moves with it, providing a hedge against the very inflation you are trying to overcome.
Conclusion: Redefining Success
The housing crisis is a reality for the wage-earner, but for the investor, it is a matter of asset allocation. If you continue to measure your home-buying potential by the growth of your paycheck, you will likely remain frustrated by the widening gap between your income and the market.
If, however, you treat your taxable brokerage account as the engine of your real estate ambitions, you change the math entirely. By building a portfolio that grows alongside, or faster than, the housing market, you move from the position of a desperate bidder to that of an empowered buyer. The goal is not just to save for a home; the goal is to reach a state of financial independence where your home is merely a portion of your wealth, rather than the entirety of it.
The path to homeownership today is paved with index funds, patience, and the strategic deployment of capital. Those who master the art of the "share-to-home" conversion will find that the dream of homeownership is not only attainable—it is significantly cheaper than it was twenty years ago.


 Nana Wu
 Sagoh
Sagoh
 Raul Delapena Setiawan
 Reynand Wu


 Azzam Bilal Chamdy
 Ali Ikhwan