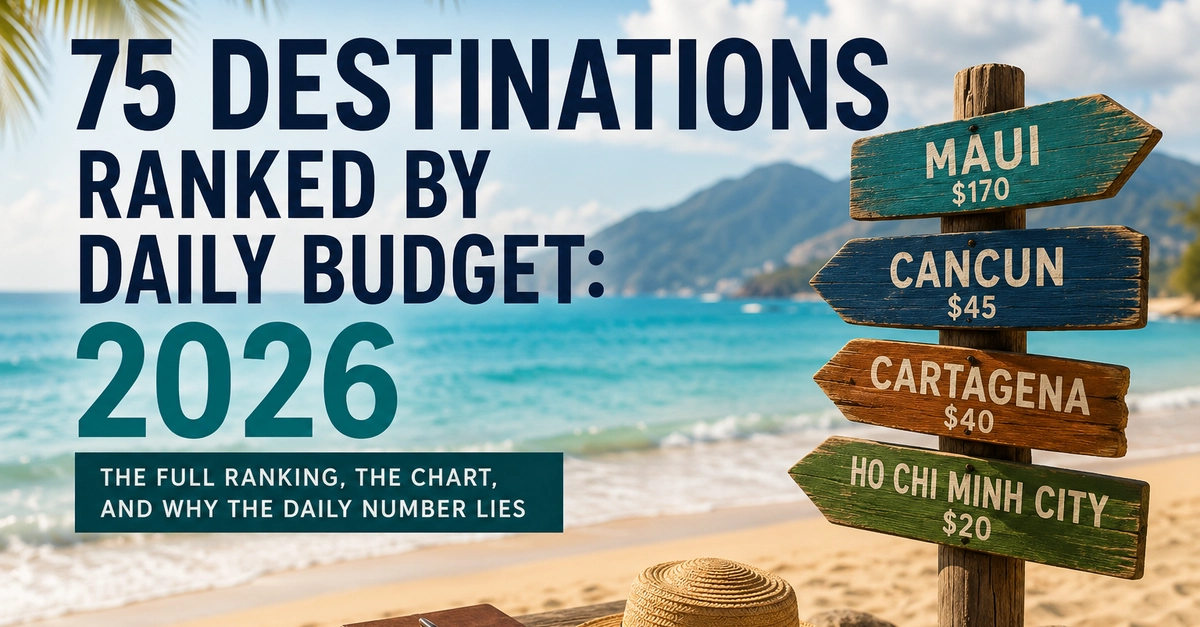
When planning a summer getaway, travelers often turn to the alluring simplicity of "daily cost" rankings. A quick search reveals that while a day in Maui might set a budget-conscious traveler back $170, a similar day in Cartagena, Colombia, costs just $40. At a glance, the math seems undeniable: one week in Hawaii costs as much as four weeks in South America. But as a deep dive into 2026 global travel data reveals, these metrics are more than just price tags—they are complex economic traps that can mislead even the most seasoned vacationer.
The Methodology: Decoding the Daily Cost
To understand the global landscape of travel expenses, data analysts at Vientapps compiled a comprehensive dataset of 75 destinations, updated between late April and early May 2026. The methodology utilizes a "budget-tier" assumption: a single traveler staying in hostels or budget guesthouses, relying on public transportation, consuming local cuisine, and prioritizing low-cost activities.
The resulting index, which ranges from $20 to $170 per day, highlights a staggering 8.5x difference between the most affordable and most expensive locales. However, this number remains a snapshot of ground costs—the literal price of existence in a city—while ignoring the massive, often insurmountable "fixed costs" of modern travel.
The Geography of Affordability
The current data illustrates a stark geographic divide. The bottom of the cost ranking is dominated almost exclusively by three regions: Southeast Asia, Latin America, and select pockets of Eastern Europe and North Africa.
The Southeast Asian Cluster
Ho Chi Minh City ($20), Chiang Mai ($25), Hanoi ($25), and Bangkok ($30) represent the gold standard of budget travel. These cities are not just affordable; they are remarkably consistent. In fact, the total daily expenditure for a week in these cities is often equivalent to the price of a single high-end dinner in a city like Reykjavik. This clustering creates a predictable environment for budget-conscious travelers, though it also signals a regional cost-of-living equilibrium that is rarely found elsewhere.
The North American Reality
Conversely, the United States dominates the top of the price index. Of 19 US destinations analyzed, 18 exceeded the global median of $85 per day. Hawaii serves as the apex of this trend, with Maui ($170) and Honolulu ($130) outstripping even the high costs of San Francisco and New York City. For travelers, this creates a "regional tax" where coastal proximity in the US essentially doubles the required travel budget compared to mainland counterparts.
Europe’s East-West Schism
Europe presents a unique case study in economic geography. The continent is split between the affordable Eastern and Southern hubs—such as Krakow and Tbilisi at $40—and the expensive Northern anchors, including Paris ($90) and Reykjavik ($120). This 300% price discrepancy within a single continent suggests that European travel is less about the destination and more about the longitude; the further east one travels, the more the purchasing power of the US dollar expands.
The "Fixed Cost" Trap: A Chronological Analysis
The most significant finding in the 2026 report is the failure of the "daily budget" to account for the duration of the trip. To understand why, one must look at the chronology of a standard vacation:
- The Planning Phase: The traveler identifies a low daily cost (e.g., $20/day in Vietnam) and assumes it is the cheapest option.
- The Booking Phase: The traveler realizes the flight to Vietnam is a 22-hour journey, costing significantly more than a short-haul flight to a domestic beach.
- The Transit Phase: The traveler loses two full days to travel, essentially "burning" budget without experiencing the destination.
- The Realization: If the trip is short (e.g., 7 days), the fixed cost of the flight heavily outweighs the daily savings. If the trip is long (e.g., 21 days), the daily savings finally amortize the cost of the airfare, making the cheaper destination truly more economical.
This creates a paradox: for the average worker with two weeks of vacation time, the "expensive" destination is often the cheaper overall choice. The daily cost is not a constant; it is a variable that fluctuates based on how long you intend to stay.
Supporting Data: Median Spending vs. Budget Reality
It is vital to distinguish between the "budget tier" and the "midrange tier." While the budget tier assumes hostel living and street food, the average traveler’s actual spending typically aligns with the midrange tier. Across the 75 cities studied, the median midrange cost sits at $160 per day. When travelers plan their trips using budget-tier numbers, they frequently underestimate their expenses by nearly double.
Comparison Table: Budget vs. Luxury Extremes
| Destination | Budget Tier ($/Day) | Midrange Tier ($/Day) |
|---|---|---|
| Ho Chi Minh City | $20 | $70 |
| Maui | $170 | $350 |
| Krakow | $40 | $110 |
| Reykjavik | $120 | $280 |
Note: Data reflects 2026 estimates.
Official Perspectives on Travel Economics
Industry experts argue that the rise of "digital nomadism" has skewed the public perception of travel costs. Because remote workers often stay in one location for months, they benefit from the "low daily cost" model. However, these figures are often touted by travel bloggers and social media influencers who fail to mention the fixed costs of travel, such as visas, long-term insurance, and the "time-cost" of flight exhaustion.
The consensus among travel economists is that the industry is currently undergoing a "transparency crisis." By emphasizing daily budgets, travel platforms are effectively gamifying the experience, encouraging users to chase the cheapest daily number without considering the total cost of ownership for the vacation.
Implications: The Future of Trip Planning
What are the implications for the future of tourism? The data suggests a shift toward "Total Cost of Ownership" (TCO) modeling. Instead of asking, "How much will I spend per day?", travelers should begin asking, "What is my total cost per hour of vacation?"
The Proposed "Total Cost" Model
To truly compare destinations, researchers are proposing a new ranking system that includes:
- The Flight Multiplier: The cost of airfare divided by the number of days stayed.
- The Time-Loss Coefficient: An estimation of how much time is lost in transit, adjusted for the traveler’s hourly wage.
- The Daily Maintenance Fee: The ground-level daily cost, inclusive of food, lodging, and local transit.
Under this model, the ranking of cities would shift dramatically. Hawaii would likely remain the preferred destination for short-duration trips, while Southeast Asia would only appear as a cost-effective option for trips exceeding 21 days. Eastern Europe would likely emerge as the "middle-ground winner," offering a balance of moderate flight costs and low daily living expenses.
Conclusion: Beyond the Spreadsheet
The data from 2026 serves as a cautionary tale: do not let the allure of a low daily budget dictate your travel plans. While $20 a day in Vietnam is a financial triumph on paper, it may be a logistical burden for a week-long excursion. Conversely, the $170-a-day price tag in Maui—while intimidating—may represent better value when the flight time and overall travel fatigue are factored into the total experience.
As we look toward the future of global travel, the most successful explorers will be those who look past the daily numbers and view their vacation through the lens of total investment. The most expensive trip is not the one with the highest daily rate; it is the one that forces you to compromise on your time, your comfort, and your sanity just to satisfy a spreadsheet. When planning your next summer escape, remember that the most valuable currency isn’t the dollar—it is the time you have to enjoy the destination.