
 Raul Delapena Setiawan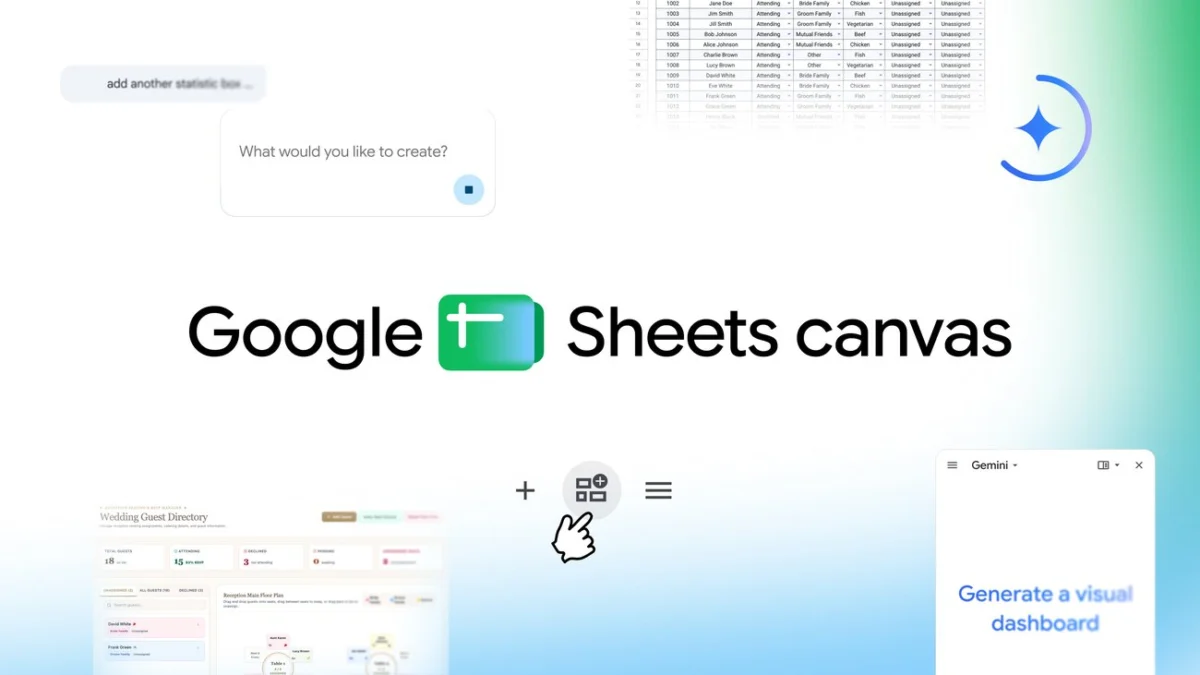
For decades, the spreadsheet has been the digital backbone of global productivity. Since the advent of VisiCalc and the subsequent dominance of Microsoft Excel and Google Sheets, the grid—composed of rows, columns, and cells—has remained the standard format for information management. However, while the grid is mathematically superior for calculation, it is often cognitively taxing for humans. Staring at endless rows of data can be an overwhelming experience, obscuring insights behind a wall of alphanumeric characters.
Google is now looking to bridge that gap with the launch of "Sheets canvas," a transformative feature powered by Gemini. By introducing a dynamic, interactive layer that sits atop traditional spreadsheets, Google aims to turn static data into functional "mini-apps." This development marks a significant shift in how users interact with their information, moving away from manual data entry and toward intuitive, visual management.
The Evolution of the Spreadsheet: Main Facts
The core proposition of Sheets canvas is simplicity through intelligence. By leveraging Google’s Gemini AI, users can now transform their spreadsheet data using natural language prompts. Instead of spending hours building complex dashboards or manually creating visualizations, a user can simply describe the desired layout or function, and the AI will generate an interactive interface.
Sheets canvas acts as a "read-write layer." This is a crucial distinction: it is not merely a static dashboard view. Any changes made within the canvas interface—such as moving a guest to a different table in a wedding seating chart or updating a student’s assignment status—are reflected instantly in the underlying spreadsheet data. This synchronization ensures that the user maintains the power of a database while enjoying the user experience of a purpose-built application.
The tool is designed for versatility. It is currently being positioned as a solution for both personal organization—such as tracking school assignments, managing fantasy football rosters, or planning events—and professional workflows, where managing project status or team resources is a daily necessity.
A Chronological Shift in Productivity
The journey toward Sheets canvas reflects Google’s broader strategy of integrating generative AI into every facet of the Workspace suite. The timeline of this rollout highlights the company’s focus on user accessibility:
- Pre-2024: Google Sheets relied heavily on manual formulas, pivot tables, and static charting tools to help users interpret data. While powerful, these tools required a steep learning curve and significant time investment.
- Early 2026: Google began aggressive testing of Gemini-integrated features, focusing on reducing the "friction of creation." The goal was to allow users to build solutions without needing to be proficient in complex spreadsheet syntax.
- August 13, 2026: The official announcement of Sheets canvas. Google unveiled the feature, demonstrating its ability to create custom study trackers, fantasy football command centers, and event management tools.
- Current State: The feature is now rolling out globally to specific tiers, including Google AI Pro and Ultra subscribers, as well as enterprise customers on Business or Enterprise Standard and Plus plans.
Supporting Data: Why Visual Layers Matter
The push for visual data tools is backed by a growing body of research regarding cognitive load and data literacy. According to studies on human-computer interaction, individuals are significantly more effective at pattern recognition when data is presented in a spatial, visual format rather than a linear table.
When managing complex datasets, the "Cognitive Load Theory" suggests that if the interface requires too much effort to navigate, the user’s ability to draw conclusions from the data diminishes. Sheets canvas addresses this by:
- Reducing Navigation Time: By providing a "canvas" view, users spend less time scrolling through thousands of rows.
- Improving Data Integrity: Because the canvas is a direct window into the data, the risk of "versioning errors" or desynchronized files is eliminated.
- Increasing Engagement: By making the interface feel like a custom-built app, users are more likely to keep their data up to date, which in turn leads to more accurate reporting.
In internal testing, Google found that users were able to complete tasks such as "reorganizing a project timeline" or "updating contact lists" up to 40% faster when using a canvas-based interface compared to standard spreadsheet navigation.
Official Responses and Strategic Intent
Eric Birnbaum, Director of Product Management for Google Sheets, has framed the launch as a democratization of data management. In his commentary, he emphasized that the objective is not to replace the spreadsheet, but to "bring your spreadsheet data to life."
"Spreadsheets are powerful, but they shouldn’t feel like a chore," Birnbaum noted during the launch. "With Sheets canvas, we are essentially giving every user the ability to be a developer. You no longer need to know how to code an app or spend hours designing a dashboard in a separate tool. If you can describe it, Gemini can build it."
Industry analysts view this as a direct competitive move against "no-code" platforms like Notion, Airtable, and Monday.com. By embedding these capabilities directly into the tool where the data already lives, Google is betting that convenience will keep users within the Workspace ecosystem rather than migrating to third-party project management software.
Implications for the Future of Work
The introduction of Sheets canvas signals a broader, long-term shift in the "future of work." We are moving toward a paradigm where the distinction between "data storage" (spreadsheets) and "data presentation" (dashboards/apps) is blurring.
The Death of the "Static" Spreadsheet
For decades, the grid has been the final destination for data. With the rise of AI-driven interfaces, the spreadsheet is becoming a backend database that the user rarely needs to interact with directly. In the future, we may see "canvas" become the default view for most spreadsheet users, with the traditional grid relegated to the background for power users and data analysts.
Accessibility and Inclusion
Perhaps the most significant implication is the lowering of the technical barrier to entry. In a traditional corporate environment, creating a project tracking app required IT involvement or at least a "spreadsheet wizard." Now, any employee—regardless of their technical background—can generate a professional, functional interface with a simple prompt. This promotes a "citizen developer" culture, where innovation is driven by the people closest to the data, rather than those with the technical expertise to manage it.
Data Security and Enterprise Adoption
As Sheets canvas rolls out to enterprise clients, the implications for data governance will be paramount. Because the canvas is merely a view layer for the underlying sheet, existing permissions, sharing settings, and data protection policies remain intact. This is a critical selling point for IT administrators who might otherwise be wary of new, AI-driven interfaces. It allows organizations to adopt the technology without compromising their security posture.
Conclusion: A New Way to See
Google’s Sheets canvas is more than just a new feature; it is a fundamental rethinking of how we interact with information. By leveraging the power of Gemini to bridge the gap between complex data and human intuition, Google is turning the spreadsheet from a static archive into a living, breathing workspace.
Whether you are a student tracking assignments, a sports fan managing a league, or a business professional organizing a complex project, the ability to turn rows and columns into a custom, interactive interface is a game-changer. As we move forward, the question for many will no longer be "how do I organize this data," but "what can I build with it?"
For those ready to embrace the change, the tools are already there, sitting inside the very sheets we have used for years. The grid hasn’t disappeared—it has simply been given a new, more intuitive face.


 Pevita Pearce
 Suro Senen
 Laily UPN
 Iffa Jayyana
 Rifan Muazin

 Lina Hope
 Lina Irawan