
 Laily UPN
In the modern enterprise, data is omnipresent. From real-time sales funnels and product engagement metrics to complex operational performance decks, organizations have never had more access to information. Yet, a recurring paradox plagues boardrooms and weekly standups alike: someone shares the latest numbers, the room offers a polite nod of acknowledgement, and the meeting concludes without a single concrete decision or shift in strategy.
Many dashboards today are technically perfect—mathematically accurate and visually polished—but communicatively inert. They function as digital monuments to past performance rather than navigational tools for future success. Meriem Benhabiles, an expert in data design, argues that the failure of these dashboards is not a deficiency of data, but a failure of design intent. When we treat data visualization and User Experience (UX) as siloed disciplines, we lose the ability to translate information into insight. By applying rigorous UX thinking to data, we can transform dashboards from passive, static logs into functional engines of organizational change.
The Disconnect: Why Data Fails to Drive Decisions
The common response to a lack of actionable insight is often a call for "more data." Teams assume that if the numbers were more granular or the dataset more complete, clarity would follow. However, this is rarely the case. The problem lies in the design process itself. Most dashboards are built around what is available in the database, rather than the questions that need answering.
When a design is born from raw data availability rather than user needs, it fails to account for the audience’s cognitive load or their specific decision-making pressures. Data visualization is fundamentally a communication task; it is the act of moving information from a source to a recipient in a way that triggers a meaningful response. When this connection is ignored, the resulting charts become mere decoration.
The Diagnostic Power of Visualization: A Historical Lesson
The necessity of thoughtful visualization was famously underscored by statistician Francis Anscombe in 1973. Anscombe presented four datasets—now known as "Anscombe’s Quartet"—that are statistically identical in terms of mean, variance, correlation, and regression. If one were to rely solely on summary statistics, these four sets would appear indistinguishable. However, when plotted on a scatterplot, they reveal wildly different patterns and underlying truths.
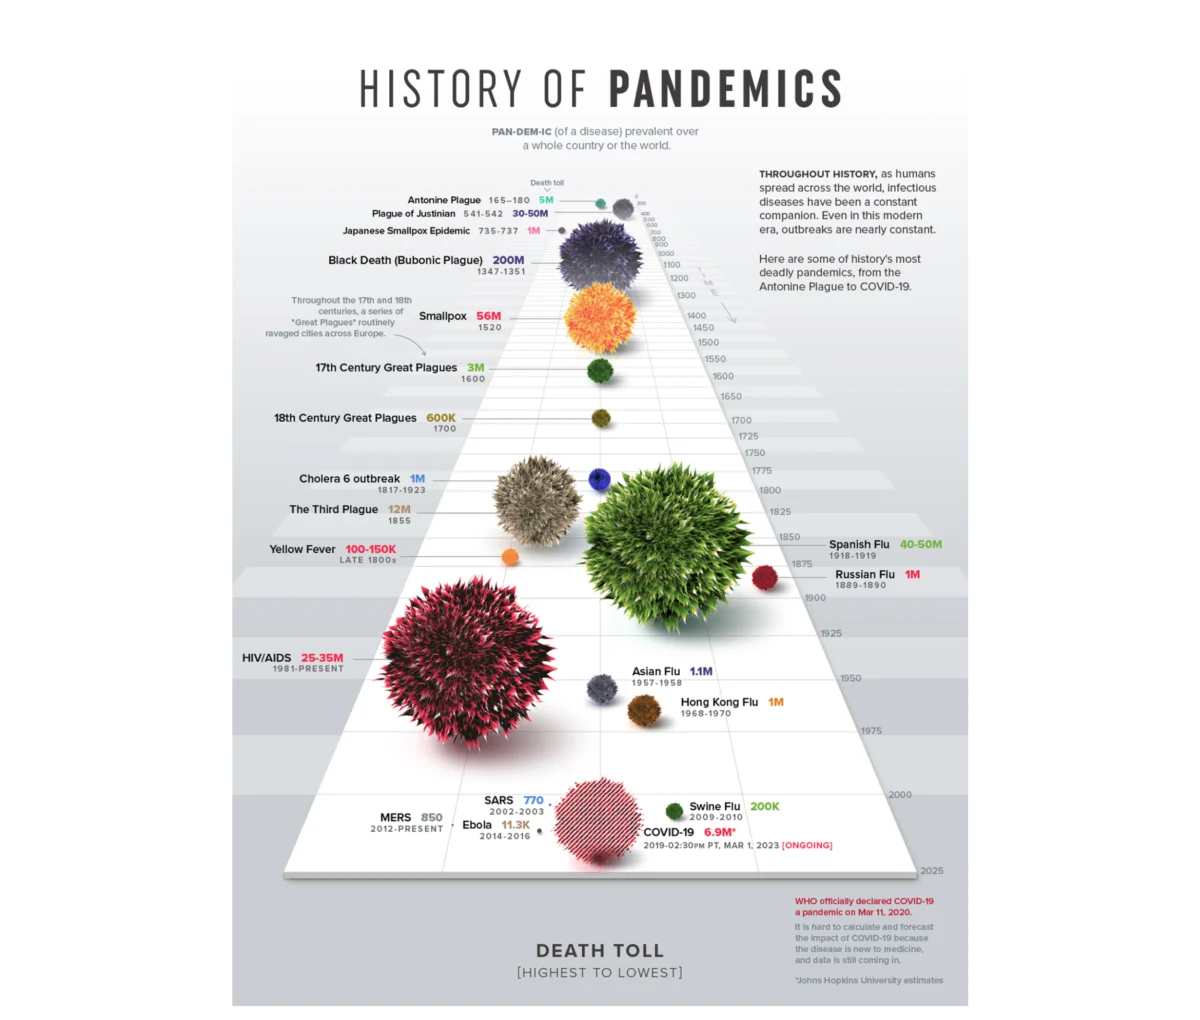
Anscombe’s lesson remains a cornerstone of the craft: visualization is a diagnostic tool that exposes truths raw numbers conceal. But beyond diagnosis, visualization is a communicative act. Consider the "History of Pandemics" by Visual Capitalist. Rather than overwhelming readers with a table of mortality statistics, it utilizes a proportional bubble layout along a timeline. The human visual system processes the scale of the Black Death relative to other events almost instantly, long before the brain processes the specific numerical labels. This is the goal of effective data UX: making the narrative impossible to miss.

The 80% Rule: Strategic Upstream Design
A foundational principle of data UX is that 80% of a dashboard’s success is determined before a single pixel is drawn or a chart is rendered. This high-leverage phase requires answering three critical questions that serve as the blueprint for the entire project.
1. Context: What is the core question?
A request to "show product performance" is not a goal; it is a vague prompt that inevitably leads to a bloated, unhelpful dashboard. A goal must be specific: "Identify which features drive retention among users who signed up in Q1." This shift moves the project from data-dumping to problem-solving. By defining a specific metric, a target population, and an implied action, the designer can filter out 90% of the noise, ensuring that every element on the screen earns its right to exist.
2. Audience: Familiarity and Accountability
Designing for an audience requires a deep understanding of their data literacy and their level of accountability. An analyst performing diagnostic discovery requires a high-density, granular environment to explore anomalies. An executive, conversely, requires a synthesized view that highlights commercial impact. Tailoring the "density dial" of a dashboard to the specific person in the room is the difference between a tool that is ignored and a tool that is used to secure budgets or pivot strategies.

3. Insight: The Definition of Change
Information is what the data says; insight is the decision made because of it. If the business team does not know what they are supposed to change after viewing a dashboard, the dashboard has failed. A well-designed view should allow a user to look at a trend and immediately understand the next logical step—whether that is to pause a failing marketing campaign or double down on a high-performing product feature.
A Project Walkthrough: From Telemetry to Transformation
In a recent engagement for a B2B SaaS platform, the challenge was to turn a massive archive of user activity into a tool for enterprise talent management. The client’s ambition was to help users "perform better."
Instead of charting everything the system tracked, the design team focused on the mechanics of professional growth. We identified that "time spent" in a module was a vanity metric; the true indicators were competency scores and certification trajectories. By integrating these into a unified narrative, we provided managers with a pulse-check on team health.

For the UI, we moved away from standard bar charts, which force the brain to perform mental arithmetic to compare eight different metrics. Instead, we utilized a radar chart. This allowed users to view a multi-dimensional "shape" of their skills. A balanced polygon indicated well-rounded proficiency, while a skewed shape instantly highlighted critical gaps. This design choice was not aesthetic; it was functional, enabling immediate pattern recognition that a list of numbers could never provide.
Implications for Organizational Culture
The impact of this approach is often reflected in the cadence of business operations. In the aforementioned B2B project, the dashboard shifted the culture from reactive to proactive. Managers stopped using the tool to conduct "post-mortems" on bad months; they began using it on Monday mornings to identify potential gaps before they manifested as project failures.
This transition has profound implications:

- Reduced Friction: By aligning visual language with brand colors and mental models, users spend less time learning the interface and more time interpreting the data.
- Increased Engagement: When dashboards provide immediate, actionable value, active engagement metrics rise organically.
- Decoupling Noise from Signal: By defining the "story" before the build, organizations avoid the costly "fire drills" that occur when data is misinterpreted due to poor framing.
Closing: Designing for the Future
Data visualization is not a "downstream" task of formatting and beautification. It is an upstream architectural choice. When we treat data design as a component of UX, we acknowledge that the ultimate user of our work is a human being operating under pressure, with limited time and a specific set of goals.
The next time you are tasked with creating a report, an enterprise dashboard, or an infographic, resist the urge to open your BI tool immediately. Step away from the screen. Ask yourself: What is the specific question we are trying to answer? Who needs to make the decision? And what, exactly, should change once they see this data?
Only when the design is anchored in these human realities will your data stop being a passive log of the past and start serving as a guide for the future. By merging the precision of data science with the empathy of UX design, we can finally turn the "nod of acknowledgement" in the meeting room into the "clear direction" that every organization requires.


 Suro Senen

 Rifan Muazin

 Iffa Jayyana


 Pevita Pearce

 Basiran

 Azzam Bilal Chamdy

 Nila Kartika Wati
