
 Iffa Jayyana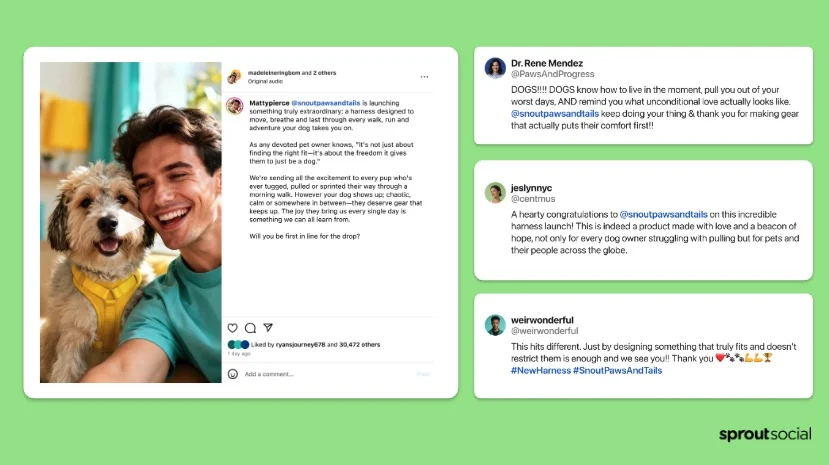
In the modern digital landscape, social media teams are effectively sitting on a goldmine. Every day, they capture the pulse of the market—unprompted, unfiltered, and raw. When brand engagement spikes or a specific product hack goes viral, the social team is the first to know. Yet, for many organizations, this intelligence remains trapped within the social dashboard. According to the 2026 Social Intelligence Report, a staggering 64% of organizations are failing to translate these insights into actionable strategies outside of the marketing department.
The disconnect is rarely a lack of data; it is a failure of narrative. When social teams present raw metrics—like "impressions" or "sentiment scores"—to stakeholders in product, sales, or executive leadership, the numbers often fall flat. To move the needle, social professionals must evolve into data storytellers, transforming spreadsheets into compelling narratives that drive actual business decisions.
The State of Social Intelligence: Why Data Gets Siloed
The primary challenge lies in the translation layer. Social media is the world’s largest, most honest focus group. Unlike CRM data or support tickets, which track customers who have already entered the sales funnel, social media captures the "pre-funnel" sentiment. It is where potential customers voice their pain points, question pricing, and rave about features long before they ever contact a sales representative.
However, the 2026 report indicates that 86% of organizations have missed significant business opportunities in the past two years simply because these insights were delayed, siloed, or ignored. This is not merely a technical limitation; it is a governance and communication failure. When data isn’t contextualized, it lacks a "so what?" factor, leaving decision-makers to treat it as noise rather than intelligence.
Defining Data Storytelling: The Art of Influence
At its core, data storytelling is the convergence of data science, narrative structure, and visual design. It is the practice of moving beyond "what happened" to explain "why it matters" and "what we should do about it."

For a social team, this means acting as a bridge between the digital conversation and the boardroom. It requires taking the quantitative (the spikes in mention volume) and pairing it with the qualitative (the actual customer language used in those posts). By marrying these two, a social manager can show an executive that a spike in mentions isn’t just "good PR"—it’s a direct correlation to a shifting market preference that should influence the product roadmap.
The Architecture of a Compelling Narrative
Constructing a story that sticks requires a disciplined approach. It is not enough to dump a series of bar charts onto a slide deck; the audience needs a clear path from observation to action.
1. Grounding Insights in Context
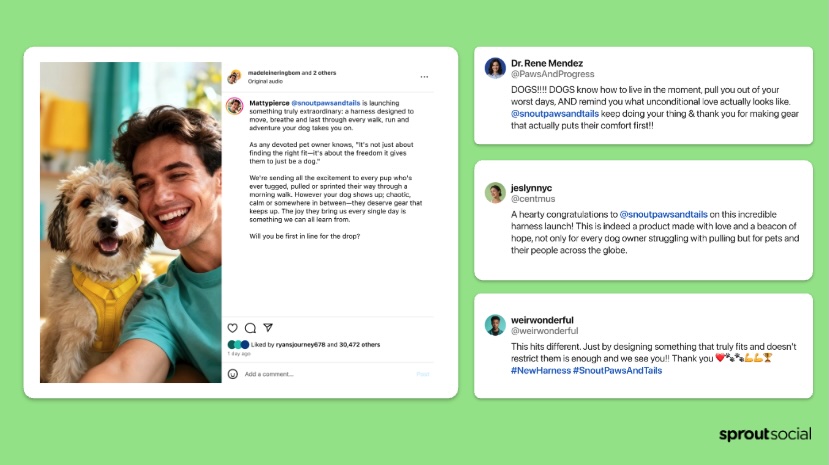
Numbers are essentially meaningless without a benchmark. To provide context, analysts must look beyond their own walls. Is the dip in sentiment specific to your brand, or is it a sector-wide trend? By pairing quantitative metrics with qualitative evidence—such as screenshots of customer comments or verbatim feedback—you transform a dry statistic into a human narrative. This human element is what makes stakeholders sit up and take notice.
2. The Power of Visual Intent
Visuals should reduce the cognitive load on your audience. If an executive has to spend more than five seconds deciphering a graph, you have already lost their attention.
- Declutter: Remove extraneous grid lines, legends, and heavy text.
- Focus: Use color to highlight the data point that matters most.
- Scale: Ensure your axes and scales provide an honest representation of the growth or decline.
3. The Narrative Arc
A strong data story follows the classic structure of a story:
- The Status Quo: Where we are right now.
- The Conflict: The market shift, the competitor move, or the customer objection.
- The Climax: The data point that illustrates the intensity of the problem or opportunity.
- The Resolution: The recommended action that solves the problem or captures the opportunity.
A Seven-Step Framework for Executable Insights
To ensure your social data drives change, follow this systematic framework before sharing your findings with other departments:
Step 1: Identify the "Aha!" Moment.
Define your objective. Are you trying to secure more budget? Are you trying to convince the product team to fix a bug? Start with the goal and work backward to find the data that supports it.
Step 2: Command Attention Early.
Lead with your second-most impactful piece of data. This hooks the audience by providing an immediate, verifiable truth that aligns with their current reality before introducing the "twist" or the new discovery.
Step 3: Integrate Visuals Fluidly.
Your visuals should appear as the narrative unfolds, not all at once. Use overlay techniques to show how one trend (e.g., social engagement) perfectly tracks with another (e.g., website conversion).
Step 4: Anticipate the Skeptic.
If you are presenting to a CFO or a product lead, they will naturally look for flaws in your logic. Address potential counter-arguments within your presentation. If you show a correlation, be prepared to discuss whether it is causation.

Step 5: The "Grand Finale" Reveal.
Save your most compelling, undeniable piece of evidence for the end. This is the "mic drop" moment that leaves a lasting impression on the decision-makers.
Step 6: Define the "So What?"
Never leave the room without a clear recommendation. Whether it is "increase ad spend on this channel" or "prioritize this feature update," the data must lead to a clear, tactical next step.
Step 7: Avoid Common Pitfalls.
Avoid burying the lead, using jargon that only social media managers understand, or ignoring the "negative" data. Transparency builds trust, and trust is the currency of influence.
Examples of Excellence: From Theory to Practice
Several organizations have set the standard for how data can be presented effectively:
- Jetpack AI: By visualizing baby name popularity through simple, interactive line graphs, they demonstrate that even simple data can become engaging if the user is invited to participate.
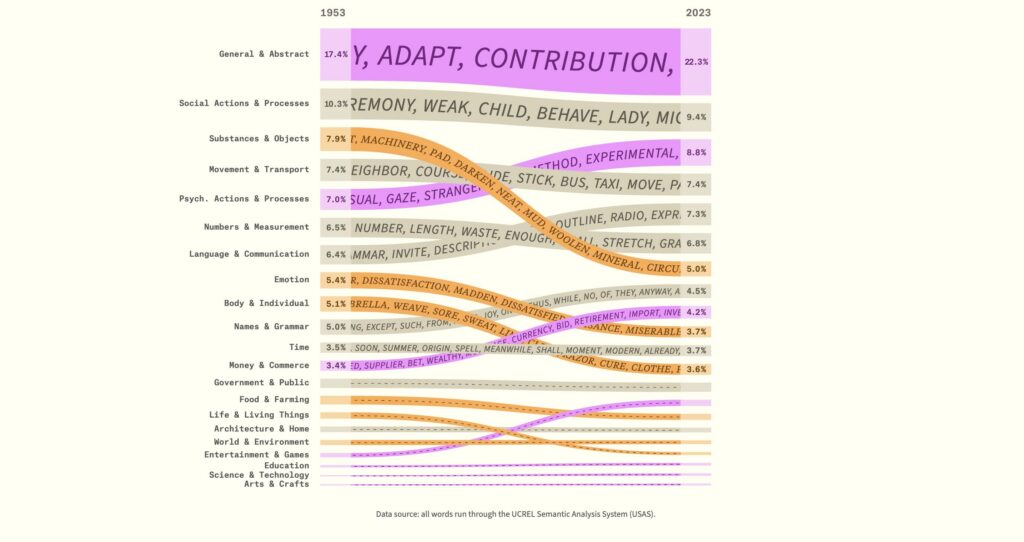
- The Pudding: As a titan of data journalism, The Pudding uses interactive, immersive storytelling to explain complex trends in vocabulary and culture, proving that context is the ultimate driver of interest.
- Sprout Social: By producing industry-specific reports that synthesize social data into digestible, actionable white papers, they demonstrate how to pair qualitative quotes with quantitative research to create a narrative that appeals to C-suite decision-makers.
Implications for the Modern Organization
The shift toward data-driven storytelling has profound implications for the structure of the modern business. When social teams succeed in becoming the organization’s "intelligence unit," silos begin to break down.
When the product team uses social sentiment to prioritize the roadmap, the customer support team uses social listening to anticipate ticket spikes, and the executive team uses social intelligence to gauge market health, the entire company becomes more agile. This creates a feedback loop where every department is informed by the real-time, unprompted feedback of the customer.
Conclusion: Crafting a Story That Travels
A good data story earns you a nod of approval in the conference room. A great data story, however, is one that travels. It is the story that gets repeated by the VP of Product in a town hall meeting; it is the report that gets forwarded to the CEO; it is the evidence that eventually justifies a multi-million dollar shift in company strategy.
To reach this level, social teams must move beyond the safety of their dashboards. They must learn to curate, translate, and narrate their findings. By grounding their data in context, structuring it with a clear narrative arc, and focusing relentlessly on the "so what," they can finally unlock the full value of the world’s largest focus group.
In an era where attention is the scarcest commodity, the ability to turn a spreadsheet into a story is not just a professional skill—it is a strategic necessity. Start by auditing your next report: are you just showing the numbers, or are you telling the story that the business needs to hear?

 Ammar Sabilarrohman
 Layla Zulfa
 Raul Delapena Setiawan
 Dwi Wanna
 Muslim
 Nana Wu

 Rifan Muazin