
 Nila Kartika Wati
In the modern digital ecosystem, social media teams sit on a goldmine of untapped intelligence. Engagement is climbing, brand mentions are spiking, and sentiment is trending upward. Yet, for many organizations, these metrics remain trapped in static dashboards, disconnected from the broader corporate strategy. While social teams hold the most unfiltered, real-time view of market sentiment—effectively managing the world’s largest, unprompted focus group—they often struggle to translate these signals into actionable business intelligence.
According to the 2026 Social Intelligence Report, a staggering 64% of organizations fail to regularly leverage social insights to inform decisions outside of the marketing department. This creates a critical "data-to-storytelling" gap. When social data is presented merely as a collection of vanity metrics, it loses its ability to influence the boardroom, product development, or customer experience. To drive real change, social teams must pivot from reporting numbers to mastering the art of data storytelling.
The Data-Storytelling Imperative
Data storytelling is the strategic synthesis of data science, narrative structure, and visual design. It is the practice of moving beyond the "what" of a spreadsheet to answer the "why" and "so what" for stakeholders who may not be fluent in social media terminology.
The necessity of this skill has never been more pressing. Research indicates that 86% of organizations have missed significant business opportunities over the past two years simply because social insights were delayed, siloed, or poorly communicated. In many cases, the insight existed, but it lacked the narrative framework required to command executive attention or trigger a shift in organizational strategy.
Why Social Intelligence is Different
Unlike CRM data or sales pipeline reports, which capture customer behavior after an interaction has already occurred, social data captures the pre-intent phase. It is where consumers voice concerns about pricing, praise features, or highlight pain points before they ever reach a support ticket or a sales representative. When a wave of social sentiment emerges—such as a viral hack for a new product—it acts as a market signal that should influence product roadmaps and R&D. Failing to move this data out of the silo is, essentially, a failure of governance.

The Building Blocks of a Compelling Narrative
To turn data into a narrative that travels through an organization, social teams must treat their reports with the same rigor as a journalist or a documentarian. The goal is to make the insights "sticky"—ensuring they are remembered and repeated in meetings where the social team isn’t even present.
Context is King
Numbers in a vacuum are meaningless. To create a strong data story, you must ground your insights in context. If you report a 15% increase in engagement, you must pair it with the "why." Did a competitor change their pricing? Did a macroeconomic shift influence consumer spending? By blending quantitative metrics with qualitative evidence—such as customer screenshots, direct quotes, or video reactions—you provide the texture that executives need to trust the data.
Visualizing with Intent
Visualization should not be decorative; it should be functional. A cluttered chart that requires a legend to interpret is a failure of communication. Every visual should be designed to highlight the specific point you are making. Use color to draw the eye to the most critical data point and keep labels concise. If a graph doesn’t help the audience reach the intended conclusion faster, it should be removed.
The Narrative Arc
The most effective data stories follow the structure of a classic narrative:
- Setting the Scene: Establish the current state of affairs.
- The Obstacle: Introduce the challenge or the market shift.
- The Climax: Present the "aha!" moment where the data reveals the hidden trend.
- The Resolution: Offer the recommendation or the path forward.
By using this structure, you transform a report into a journey, guiding stakeholders toward a specific, informed decision.
A Step-by-Step Framework for Impact
To ensure your data stories drive results, follow this systematic approach before presenting your findings:
1. Identify the "Main Character" of Your Data
Before you build a single slide, define your objective. Are you trying to secure a larger budget? Are you warning the product team about a growing concern? Choose the specific data points that best serve that goal. Often, the data that contradicts your initial expectations makes for the most compelling story.
2. The Hook: Lead with the Second-Best
Human attention spans are finite. Don’t start with a boring overview of KPIs. Open with a provocative, secondary insight that commands attention. For example: "While everyone is focused on our sales growth this quarter, our social data shows that 33% of that growth is tied to a single, unprompted influencer post that we didn’t sponsor."
3. Visuals as Narrative Anchors
Use your visuals as physical anchors during your presentation. As you talk, let the charts appear in sync with your narrative. If you are discussing a correlation between social traffic and conversion, let the traffic graph appear first, then overlay the conversion data to show the impact.
4. Proactive Defense: Predicting the "So What?"
Every executive will have the same instinctual questions: "Is this a trend or an outlier?" "Is this correlation or causation?" Build these answers into your presentation. By proactively addressing challenges, you demonstrate a deep mastery of the data and keep the audience focused on the conclusion rather than getting stuck on potential objections.
5. The Grand Finale: Your Strongest Insight
Save your most significant piece of data for the end. This is your "closer." Whether it’s a revelation about a customer segment or a clear ROI metric, this is the takeaway that your audience will carry out of the room.
6. The Actionable Closing
Data storytelling is incomplete without a call to action. End by clearly defining what should happen next. Whether it’s a change in media spend, a pivot in product features, or an increase in customer support staffing, the "so what" must be explicit.
Common Pitfalls to Avoid
Even with great data, stories can fail if they fall into common traps. Avoid "data dumping"—the tendency to include every chart you have rather than the ones that matter. Avoid overly technical jargon that alienates non-social stakeholders. Most importantly, avoid presenting data without a clear conclusion. A report that just says "here is what happened" is a log; a data story is a roadmap.
Case Studies in Effective Storytelling
The industry’s best examples of data storytelling share a common trait: they simplify the complex.
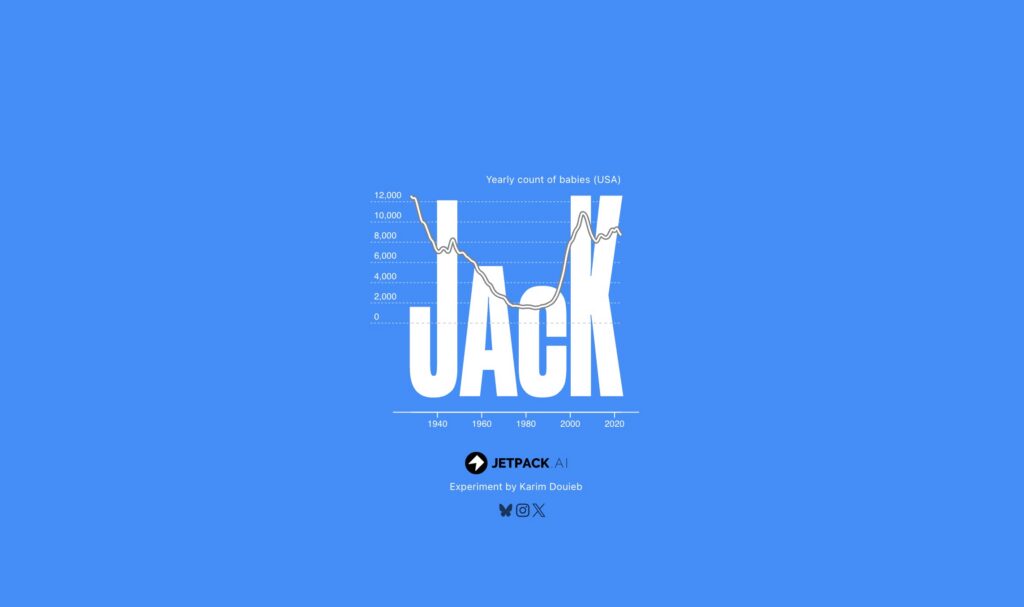
- Jetpack AI’s Baby Names Visualization: This tool turns a massive dataset into a personal, interactive experience. By allowing users to input their own name, it gamifies the data, making it both memorable and easy to understand.
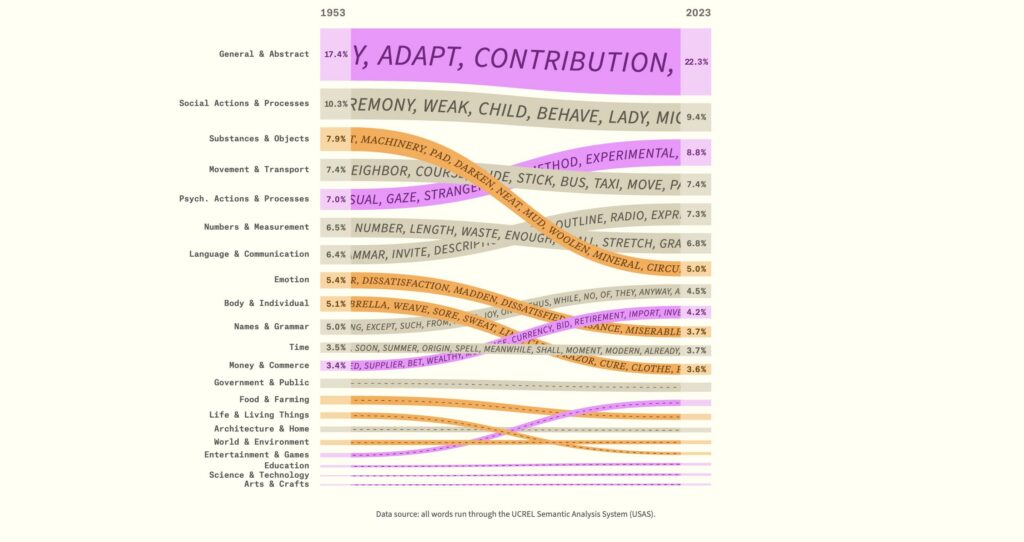
- The Pudding: As a gold standard in data journalism, The Pudding excels at using interactive elements to provide context. Their analysis of vocabulary trends over time shows how clear, visual storytelling can turn abstract concepts into tangible insights.
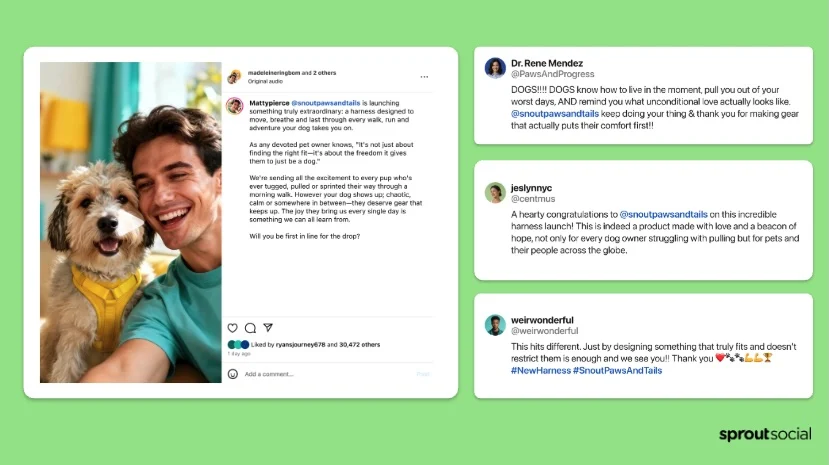
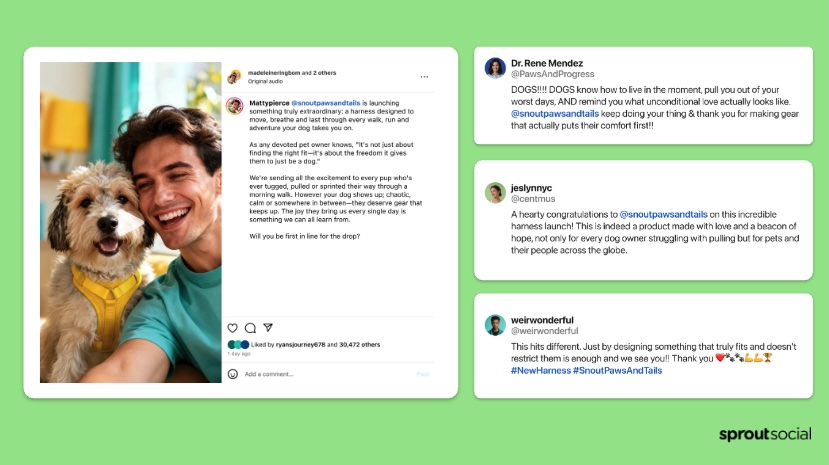
- Sprout Social’s Research Reports: By pairing digestible narratives with clean, intentional visuals, Sprout provides a blueprint for how to package complex social intelligence into reports that executives actually want to read.
Implications for the Future
The ability to translate social intelligence into a narrative is becoming a core competency for modern leadership. As the digital landscape grows more crowded, the companies that win will not necessarily be those with the most data, but those that can best interpret that data to move their business forward.
When a social team moves beyond the dashboard and into the boardroom, they shift their role from a cost center to a strategic advisor. This evolution requires discipline, a focus on the audience, and the courage to tell the story that the data is screaming to be heard.
As we look toward the future, the integration of AI and predictive analytics will only increase the volume of social data. The organizations that survive this "data deluge" will be the ones that prioritize the storyteller over the analyst. Your data is the raw material; your narrative is the product. Start crafting stories that travel, and you will find that your social insights are no longer just numbers—they are the catalysts for your company’s next big move.


 Ammar Sabilarrohman
 Sagoh

 Raul Delapena Setiawan

 Reynand Wu



 Azzam Bilal Chamdy

 Ali Ikhwan
