
 Ammar Sabilarrohman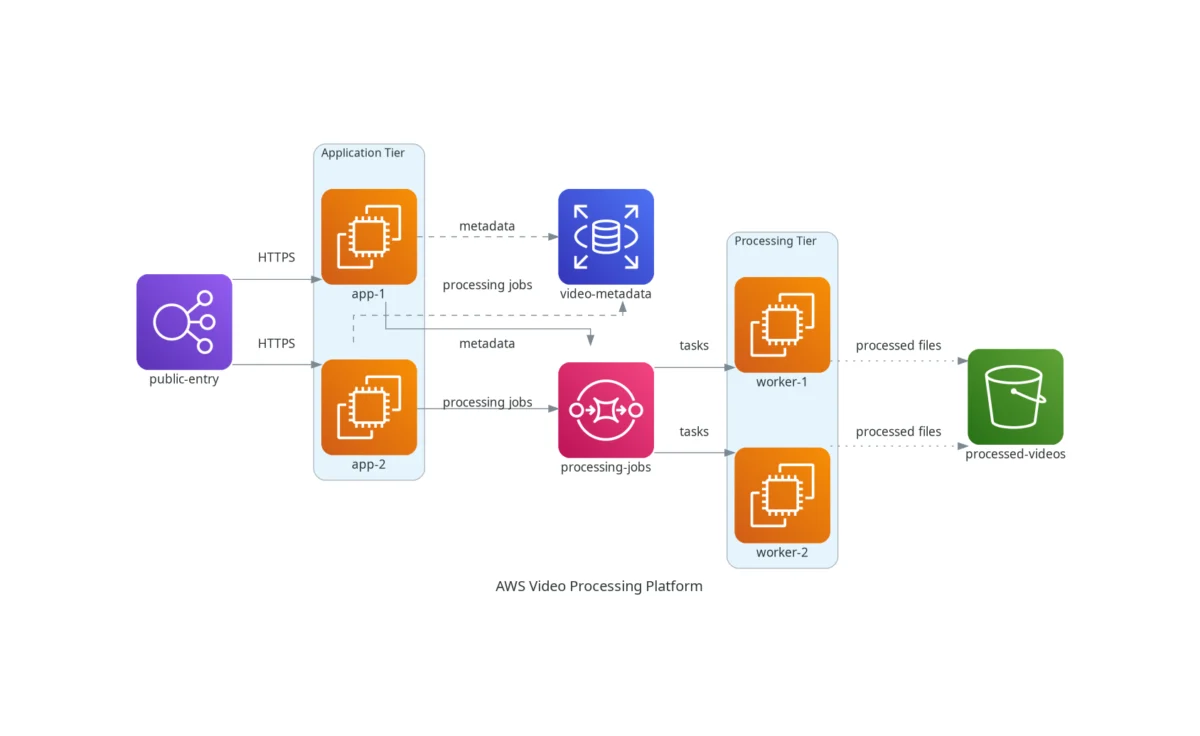
In the modern era of cloud-native development, technical documentation is often the silent bottleneck of engineering velocity. As systems evolve into complex meshes of microservices, serverless functions, and distributed databases, the traditional method of manually dragging and dropping icons onto a digital canvas is increasingly untenable. When architecture shifts, updating these visual representations often becomes a tedious, error-prone chore that is frequently ignored, leading to "documentation drift"—where the diagram no longer reflects the reality of the code.
Enter the "Diagram-as-Code" paradigm. This approach shifts the responsibility of drawing architecture from the manual labor of a designer to the automated precision of a developer. By leveraging tools like the Python Diagrams library, engineers can version-control their system designs, treat architecture as infrastructure, and ensure that documentation remains as dynamic as the codebase itself.

The Shift: Why Static Diagrams are Failing Engineering Teams
For years, tools like Lucidchart, Visio, and Draw.io have been the industry standards for system design. While these platforms offer high fidelity and drag-and-drop ease, they suffer from significant scalability issues. In an agile environment, where a sprint might involve adding three new microservices or reconfiguring a VPC, manually updating a static image file is an afterthought.
When documentation is disconnected from the development workflow, it quickly becomes obsolete. This creates a "knowledge gap" for new developers onboarding into a team, who must rely on outdated diagrams that do not accurately represent the current production environment. Furthermore, static images are difficult to review in a Pull Request (PR) workflow. You cannot easily see "diffs" on a PNG file, making it impossible to track how an architecture has evolved over time.
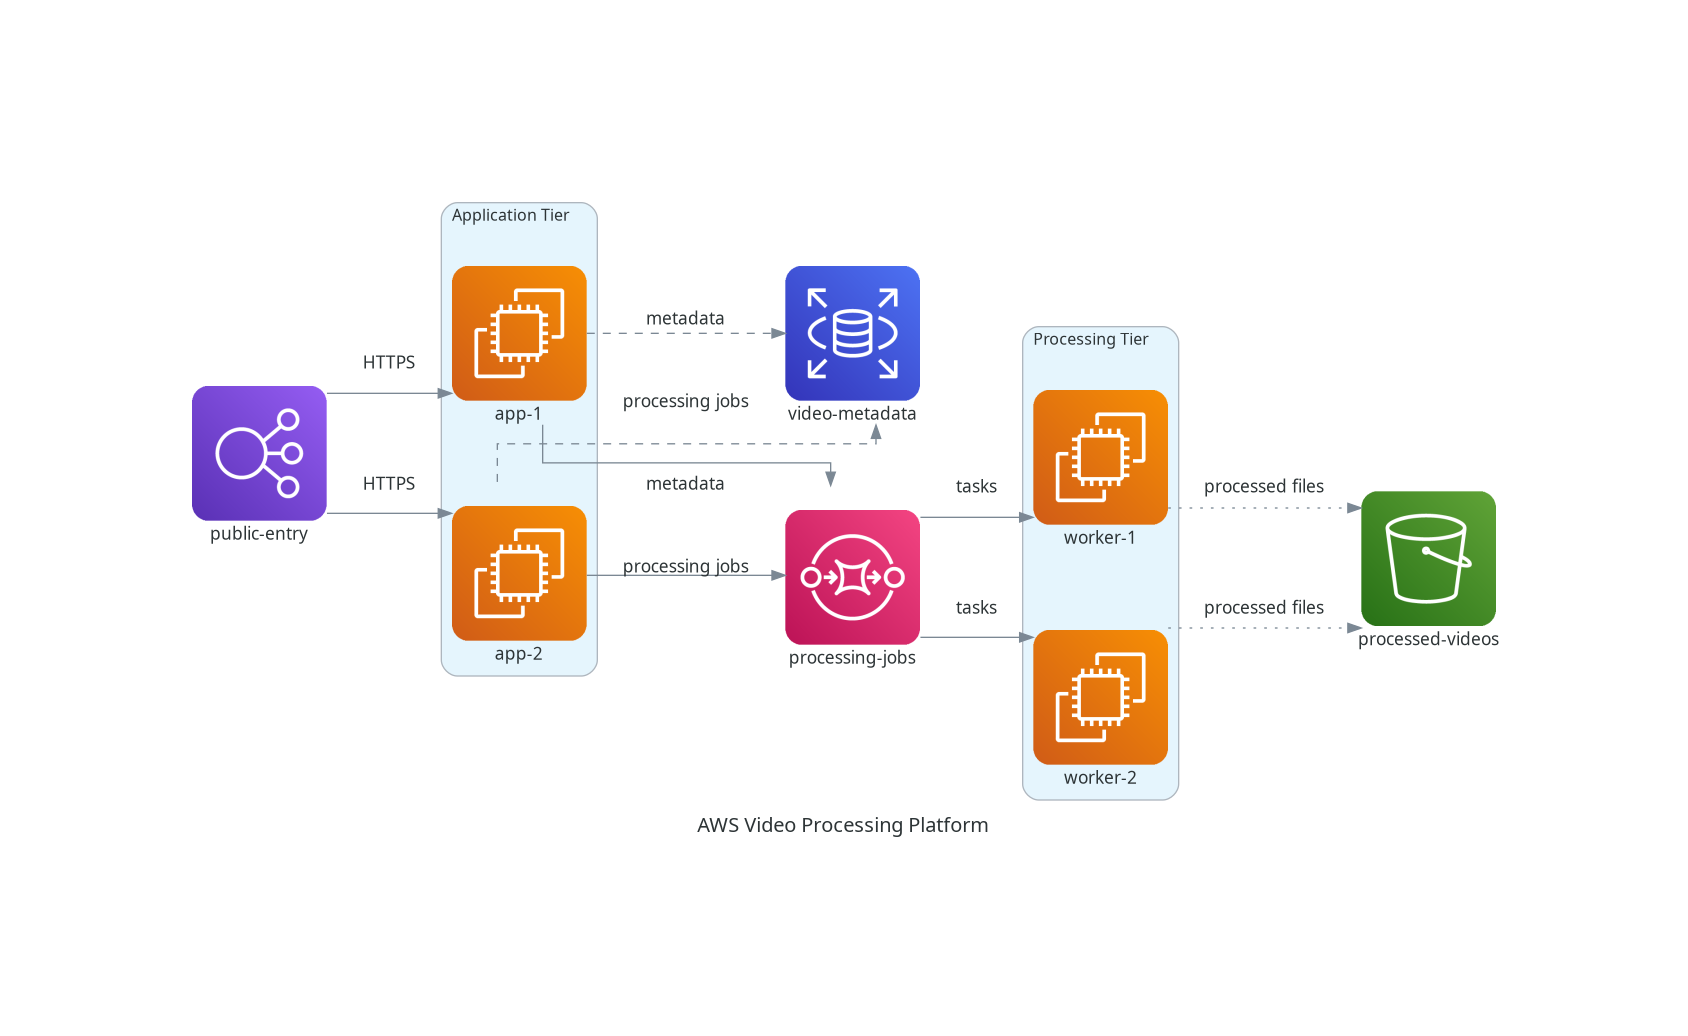
Diagram-as-code bridges this gap by allowing developers to define system architecture using familiar syntax. By storing these definitions in Git, teams can track changes, comment on architectural decisions within PRs, and generate diagrams automatically as part of a CI/CD pipeline.
The Mechanism: How Python’s Diagrams Library Operates
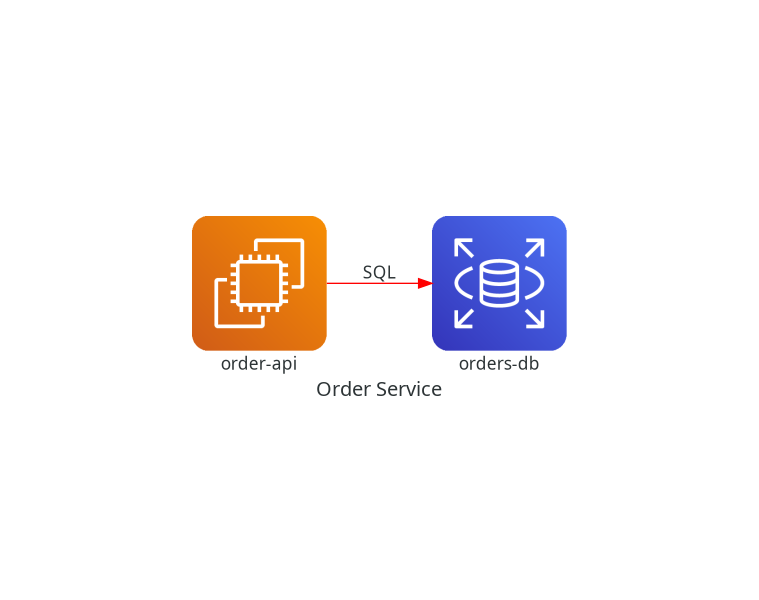
The Diagrams library provides a robust framework for drawing cloud system architecture without the overhead of design software. It acts as a wrapper around Graphviz, the open-source graph visualization software. By defining nodes and their relationships within a Python script, users instruct the library to render professional-grade architecture diagrams automatically.

Chronology of a Diagram Build
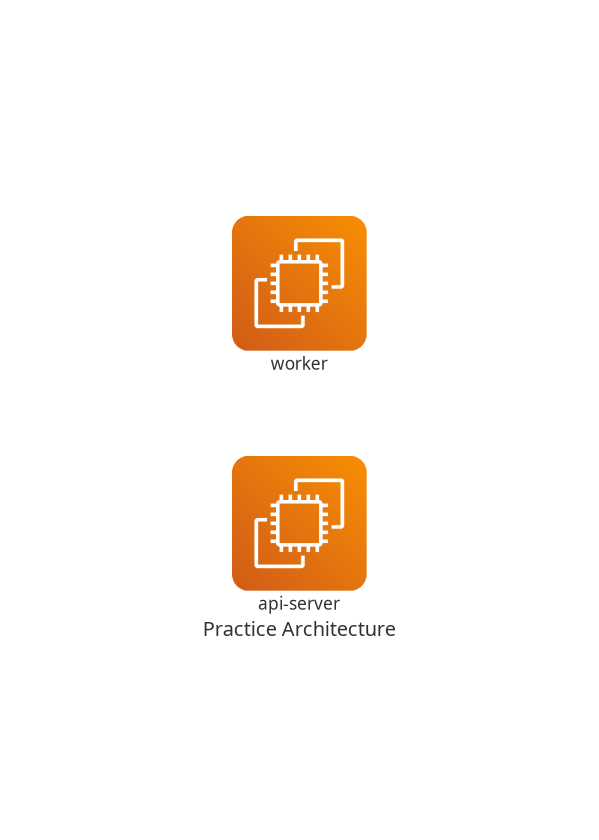
- Context Initialization: The process begins by defining a
Diagramobject. This acts as the "canvas" for your architecture. - Node Instantiation: You import specific resource types (e.g.,
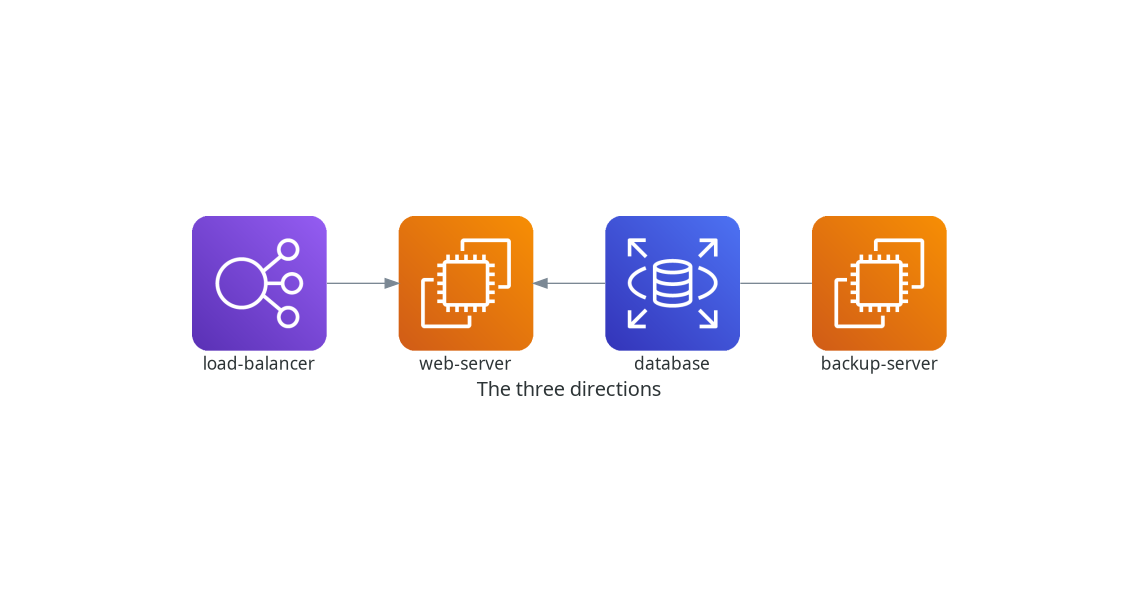
EC2,RDS,Lambda) from the library’s vast provider-specific modules (AWS, Azure, GCP, Kubernetes, etc.). - Relationship Definition: Using intuitive operators like
>>,<<, and-, you define the flow of data between nodes. - Rendering: Upon executing the Python script, the library generates a visual representation of the defined graph, which is then saved as a high-resolution image file.
This approach removes the "thinking" from the layout process. You don’t need to worry about spacing, alignment, or color palettes; the underlying engine handles the rendering logic, ensuring a consistent aesthetic across all architectural documents.
Scaling Architecture: Advanced Grouping and Nesting
As organizations scale, so too does the complexity of their infrastructure. A single AWS account might contain dozens of services, and visualizing this without proper structure leads to "spaghetti" diagrams. The Diagrams library addresses this through the concept of Cluster objects.

Hierarchical Visualization
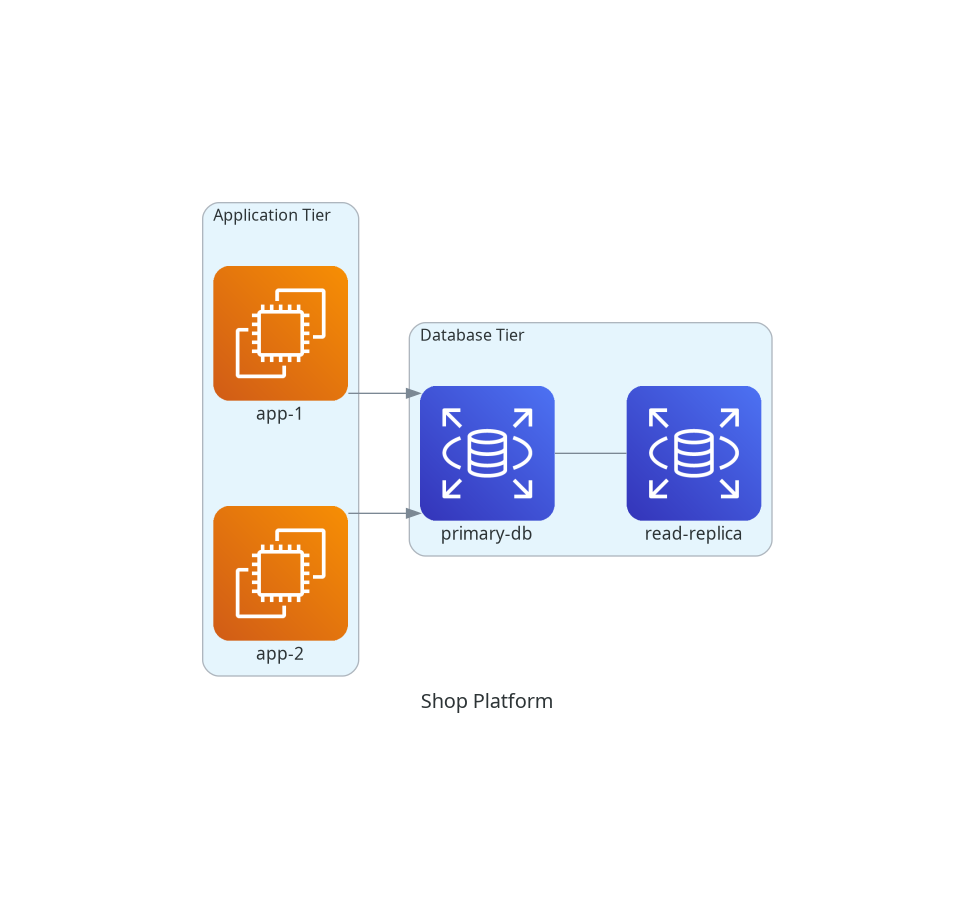
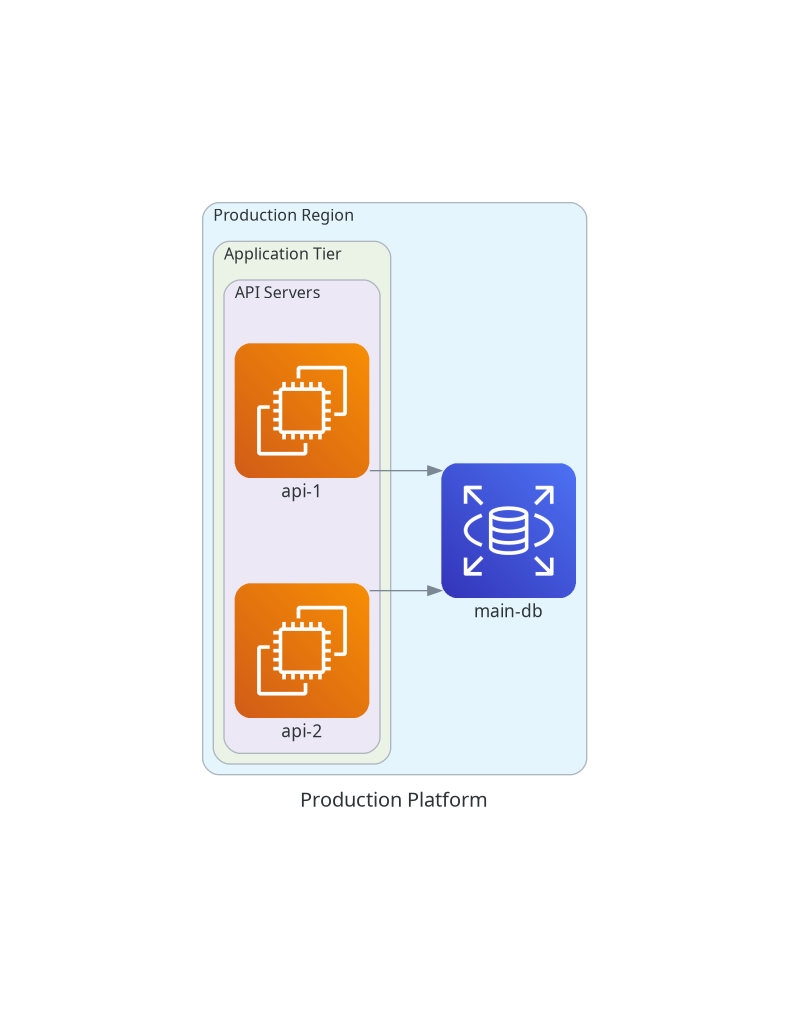
Clusters allow developers to group related components into logical boundaries. Whether it’s separating a "Production Region" from a "Staging Region," or nesting an "API Tier" within a "Virtual Private Cloud," the syntax is both expressive and intuitive.
By utilizing nested clusters, architects can create multi-layered, readable diagrams that convey complex relationships at a glance. This is particularly useful for enterprise environments where stakeholders need to understand high-level platform structure without getting bogged down in individual node details.
Supporting Data: Why Programmability Wins
Data suggests that developers spend approximately 15-20% of their time on documentation-related tasks. In teams where manual diagramming is standard, this time is often inefficiently spent on formatting and layout adjustments.
According to internal engineering surveys, adopting a code-based approach to documentation reduces the time required to update architectural diagrams by an estimated 60-70%. Furthermore, because the diagram is tied to a specific version of the code, it eliminates the confusion caused by "stale documentation."
Key Advantages:
- Version Control: Every change to the architecture is documented in the commit history.
- Automation: Diagrams can be regenerated automatically during deployment, ensuring the visual representation is always in sync with production.
- Standardization: Teams can enforce a unified visual style by sharing configuration templates, ensuring that diagrams created by different team members look consistent.
Official Perspectives and Industry Adoption
Industry leaders in DevOps and Site Reliability Engineering (SRE) have increasingly embraced "Infrastructure-as-Code" (IaC) tools like Terraform and Pulumi. The rise of Diagram-as-Code is a natural extension of this philosophy. If we are defining our infrastructure via code, it follows that our visual documentation should be generated from that same source of truth.
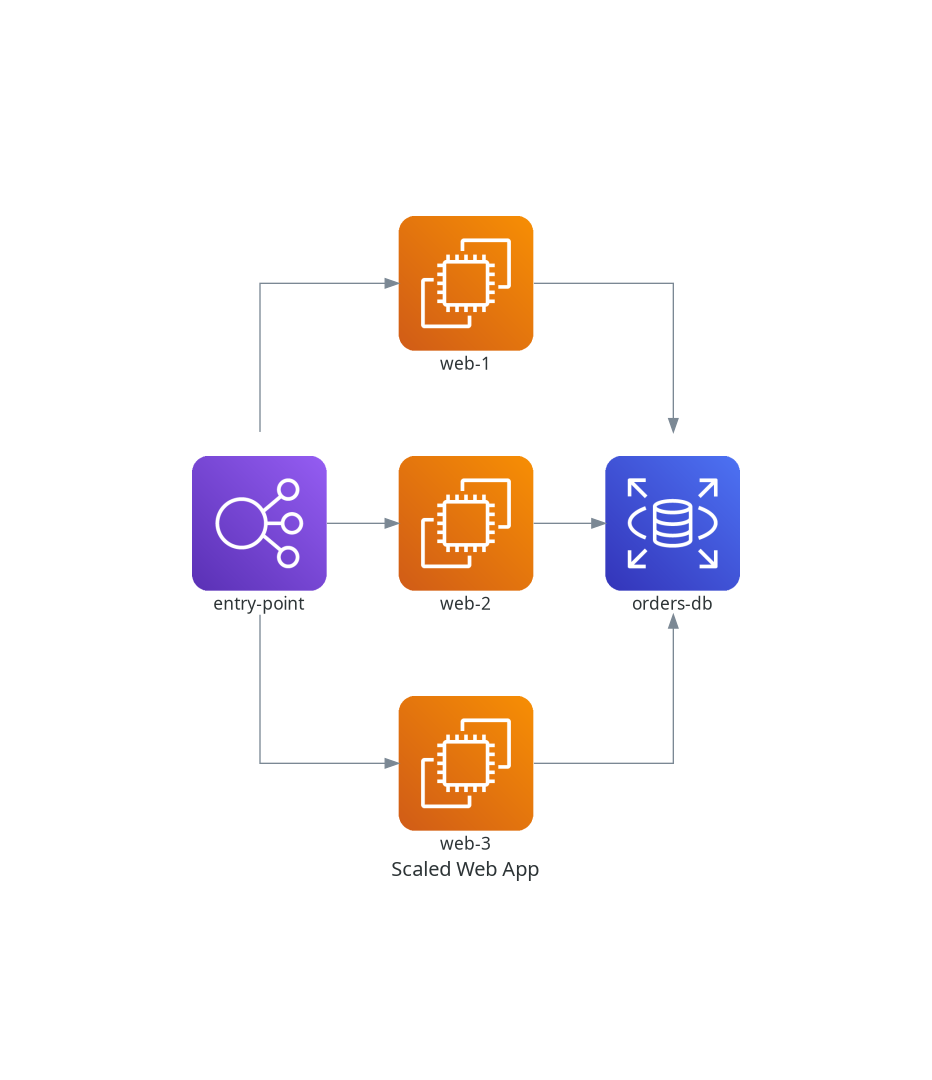
Many open-source projects have begun integrating Diagrams into their README files. By checking a diagram.py file into the root of a repository, maintainers provide a self-documenting system that contributors can easily modify or reference. This democratizes the documentation process, moving it from the hands of an "architect" to the hands of the entire engineering team.
Implications for the Future of Technical Writing
The implications for the future of technical documentation are profound. We are moving toward a future where "documentation" is not a separate document—a PDF or a Wiki page—but an integrated component of the software development lifecycle (SDLC).
The "Living Documentation" Era
As AI and LLMs (Large Language Models) become more integrated into the development process, we will likely see tools that can auto-generate Diagrams code directly from existing cloud infrastructure (like AWS CloudFormation templates or Terraform state files). This would essentially eliminate the need for manual diagram creation entirely. Imagine an environment where, upon deploying a new service, the system automatically updates the internal architectural map, sends a notification to the team, and updates the project’s documentation site.
Challenges and Considerations
While the advantages are clear, there are hurdles to widespread adoption. The primary challenge is the learning curve for non-technical stakeholders. While a developer may find Python syntax intuitive, a Product Manager or a business stakeholder may prefer the tactile nature of drag-and-drop tools.
To mitigate this, organizations must find a balance. Diagram-as-code is excellent for internal engineering documentation, where speed and accuracy are paramount. However, for client-facing presentations or high-level business roadmaps, traditional visual design tools may still hold a place.
Conclusion: A New Standard for Clarity
The transition from manual drawing to programmatic generation represents a significant maturation in the way we document software. By treating our diagrams as code, we inherit the benefits of software engineering best practices: peer review, versioning, modularity, and automation.
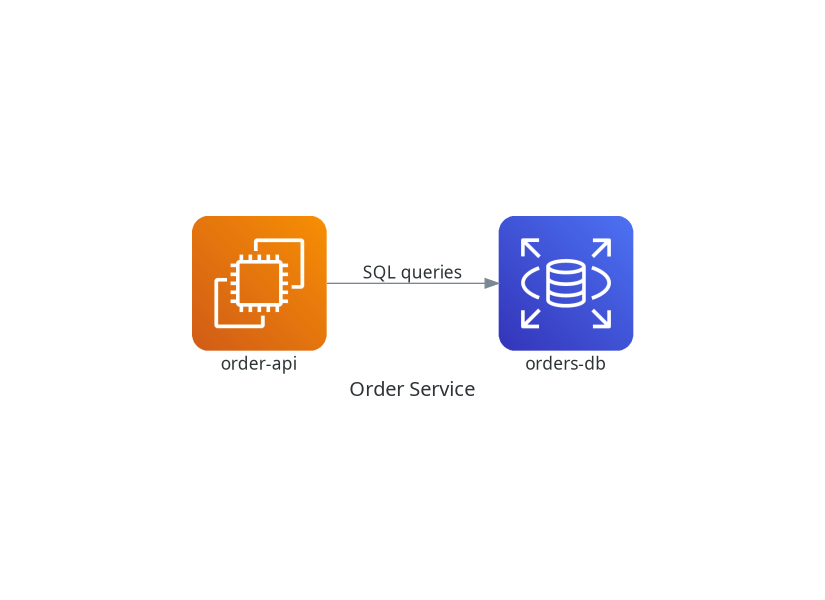
The Diagrams library is not merely a tool for creating pretty pictures; it is a tool for clarity. In a field defined by constant change and increasing complexity, the ability to clearly visualize our systems is a competitive advantage. As we continue to build more distributed and resilient architectures, the tools we use to document them must evolve in lockstep.
For those looking to improve their team’s documentation hygiene, starting with a simple Diagram-as-Code implementation is the first step toward a more transparent and efficient engineering culture. Whether you are managing a small startup’s microservice architecture or a large-scale enterprise cloud environment, the programmatic approach ensures that your documentation remains as robust as the systems it describes.
Next Steps for Implementation:
- Audit: Identify the most critical, yet frequently outdated, architectural diagrams in your current documentation.
- Pilot: Select a small, isolated component of your system to represent using the
Diagramslibrary. - Integrate: Once successful, move the generation script into your CI pipeline so that documentation is rendered as a build artifact.
By adopting these practices, you are not just saving time; you are ensuring that the map of your digital world stays accurate, accessible, and aligned with the code you ship every day.


 Rifan Muazin
 Sagoh
Sagoh
 Laily UPN
 Iffa Jayyana
 Suro Senen
 Lina Hope
 Lina Irawan