
 Raul Delapena Setiawan
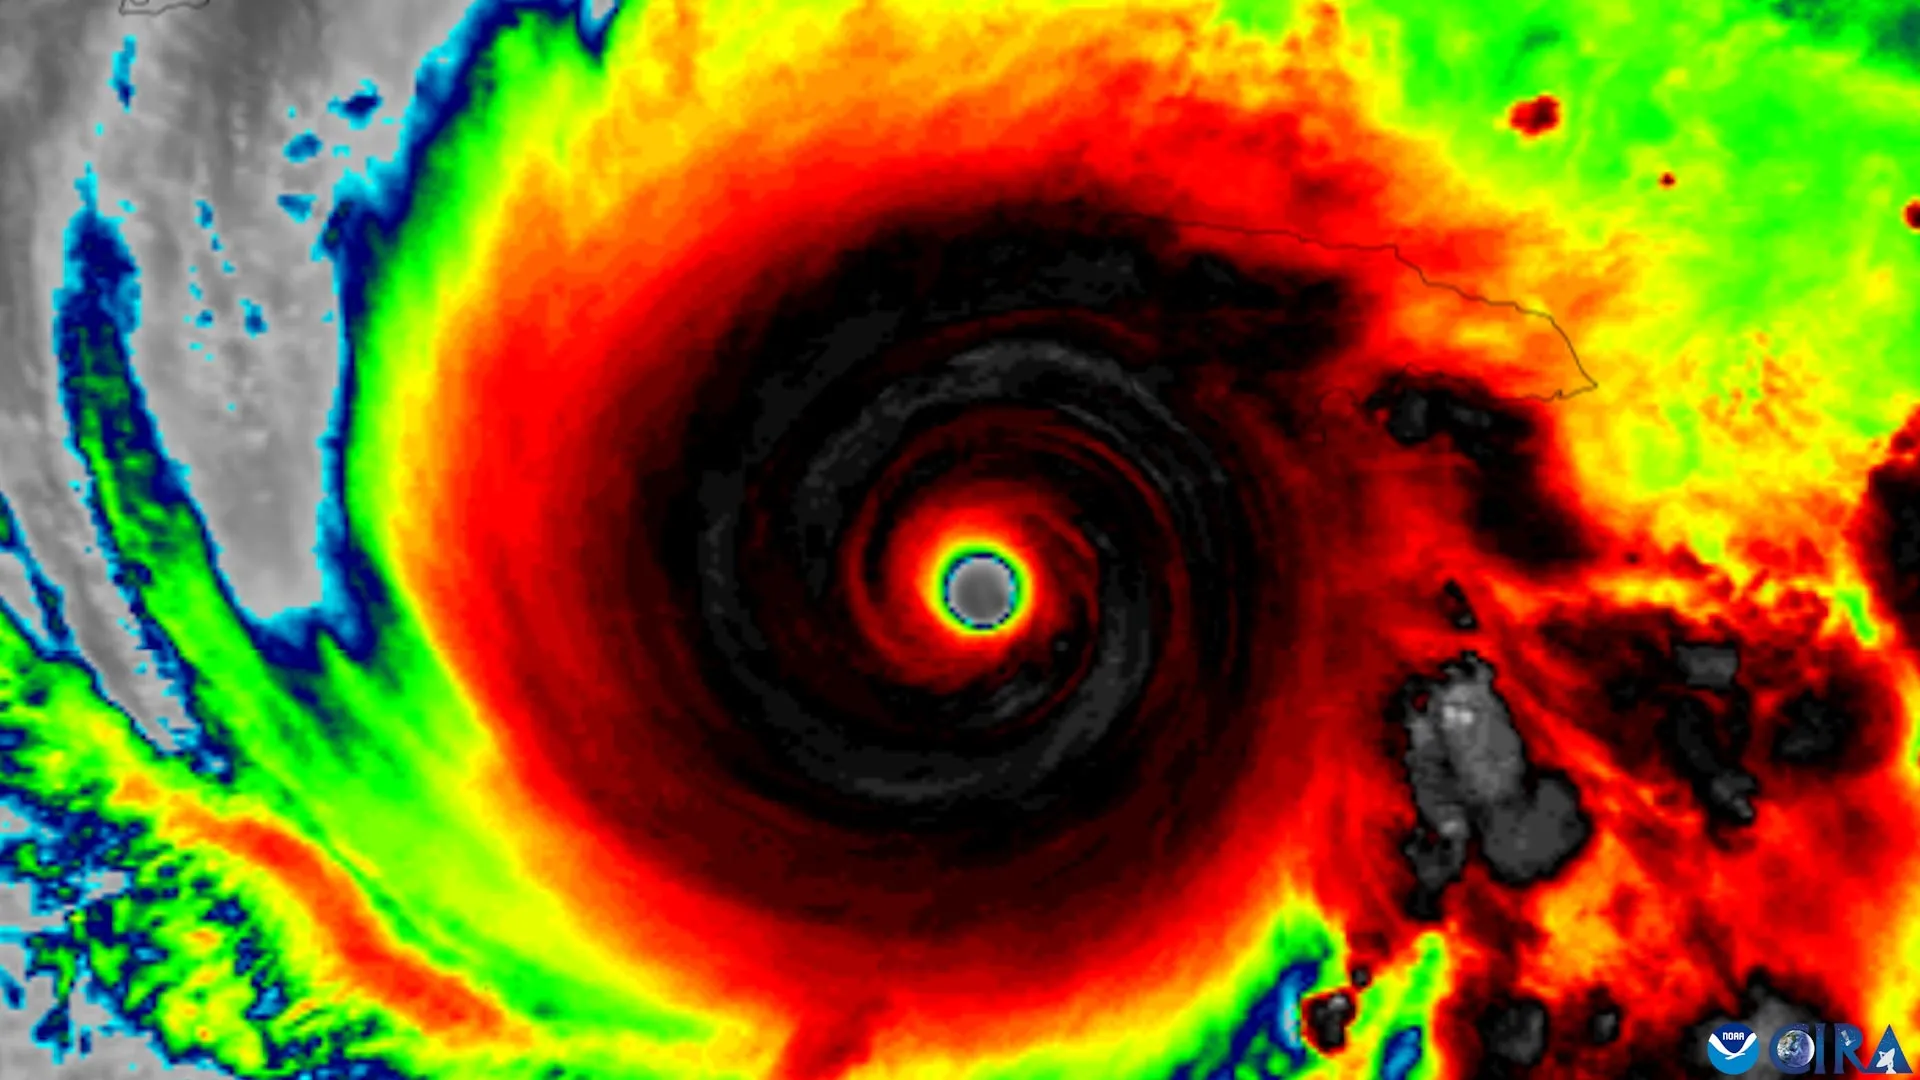
As hurricane seasons become increasingly unpredictable and inland flooding events grow more frequent, the National Hurricane Center (NHC) has been under mounting pressure to modernize its communication tools. In 2024, the agency introduced an experimental "extended" forecast graphic designed to highlight inland storm threats—a critical shift aimed at educating a public historically focused on coastal exposure.
However, new, rigorous research from Florida State University (FSU) suggests that while these graphical updates are technically sound, they are hitting a psychological wall. The study, published in the American Meteorological Society journal Weather, Climate, and Society, reveals a disconnect between data literacy and risk perception: even when residents can correctly identify a watch zone on a map, that knowledge is failing to translate into increased personal concern or a willingness to take life-saving precautions.
The Evolution of the "Cone of Uncertainty"
For decades, the "cone of uncertainty" has been the centerpiece of hurricane forecasting. It is an iconic, if often misunderstood, visualization. To a meteorologist, the cone represents the probable track of the storm’s center, with the width narrowing or widening based on the historical accuracy of track forecasts for that specific lead time.
For the average citizen, however, the cone has often been a source of confusion. Research has long indicated that the public frequently mistakes the cone’s width for the storm’s physical size—believing that if they are outside the shaded area, they are safe from wind and rain. This misconception persists despite years of public education campaigns.
In 2024, the NHC attempted to mitigate this by expanding the graphic to explicitly include inland hurricane and tropical storm watches and warnings. The goal was to move the needle on public perception, forcing residents hundreds of miles from the coastline to recognize that they are not immune to the destructive potential of a landfalling system, such as inland flooding, tornadoes, or wind-driven debris.
The FSU Study: Methodology and Findings
To test the efficacy of this new design, researchers from FSU’s School of Communication and the Department of Geography conducted a targeted survey of residents in Florida and Georgia—two states frequently battered by Atlantic storms.
The study utilized a randomized controlled trial format. Participants were presented with either the traditional "cone" graphic or the updated experimental version that incorporated inland hazard data. The research team then measured two distinct variables: the ability to interpret the map correctly (data literacy) and the resulting intent to prepare (behavioral change).
Key Findings:
- Improved Recognition: Participants viewing the updated, expanded graphic were significantly better at identifying inland areas under active hurricane or tropical storm watches compared to those viewing the traditional map.
- The "Risk Gap": Despite the improved recognition, there was no statistically significant increase in the participants’ perception of personal danger.
- Stagnant Preparedness: Even when participants correctly identified that they lived within a "watch" or "warning" area, their intent to take protective measures—such as securing property or planning for evacuation—remained unchanged.
- Persistent Misconceptions: The "width-as-size" bias remains deeply ingrained. Regardless of the graphic design, many participants continued to interpret a wider cone as a larger, more dangerous storm, illustrating the difficulty of correcting long-standing visual misconceptions.
Why Better Information Does Not Equal Better Preparation
The central question posed by the research team was: Do these changes actually help people understand the risk they face? The answer, according to lead author and Assistant Professor Elizabeth Ray, is complex.
"The National Hurricane Center has made a number of thoughtful changes to improve how hurricane information is communicated," Ray noted. "The science is excellent. The question is how we communicate that science so people who aren’t meteorologists understand the risk they’re facing."
The study suggests that human psychology often acts as a filter for scientific data. When a resident sees a weather graphic, they are not just looking at meteorological data; they are assessing their own comfort, history, and perceived vulnerability. If a person has lived through a hurricane without suffering significant damage, they may suffer from "optimism bias," where they subconsciously downplay the threat of a new storm regardless of how clear the map is.
Furthermore, the "information overload" phenomenon may play a role. By adding more layers of data—such as inland watches and warnings—to an already dense graphic, the NHC may inadvertently be creating a situation where the user recognizes the technical information but struggles to synthesize it into a coherent action plan.
Implications for Public Safety and Emergency Management
The findings from the FSU study have profound implications for how emergency management agencies communicate during extreme weather events. If the gold standard of meteorological visualization—the NHC forecast cone—is failing to drive protective action, it suggests that the burden of safety communication cannot rely on a single image.
The Role of Contextualized Communication
The researchers emphasize that the quality of the weather prediction is not the problem. Meteorologists at the NHC are providing the most accurate data in history. The problem is the "last mile" of communication: the moment the information reaches the public.
"Our findings are a reminder that one graphic can only tell you part of the story," says co-author Patrick Merle, professor and director of the School of Communication. "Don’t rely on the cone alone. Pair it with clear, local information about what impacts to expect and what actions to take."
Moving Beyond "The Cone"
The study recommends a multi-faceted approach to public safety communication:
- Hyper-Local Messaging: Instead of relying on regional graphics, communication strategies should prioritize local impacts (e.g., "This specific county will experience 6–8 inches of rainfall") over regional track maps.
- Action-Oriented Language: Warnings should be paired with concrete instructions. Rather than saying "expect tropical storm conditions," messaging should shift toward "clear your yard of loose items and prepare for power outages."
- Visual Literacy Training: There is a clear need for public education regarding the limitations of the cone. Campaigns should emphasize that the cone represents uncertainty in the track, not the intensity or size of the storm.
Official Responses and Future Research
The National Hurricane Center has maintained an open, collaborative relationship with the researchers throughout this process. By providing the experimental graphics for the study, the NHC demonstrated a commitment to evidence-based communication.
The study, supported by an internal FSU SEED grant, highlights the necessity of interdisciplinary work. By combining geography—which deals with the physical reality of the storm—and communication science—which deals with human perception—the FSU team has provided a blueprint for how future weather graphics should be tested before they are released to the public.
"The goal is to empower people with information they can use to stay safe," Merle said. If that goal is not met, the communication has fallen short, regardless of how much technical data was included in the broadcast or the app.
Conclusion: A Call to Action for Residents
As the climate shifts, the geographic footprint of hurricane damage is expanding. The FSU study serves as a stark reminder that while we have the technology to predict the path of a storm with greater precision than ever before, we have yet to master the art of convincing the public to act on that knowledge.
For residents, the takeaway is clear: the forecast cone is a tool, not a complete safety manual. When a hurricane approaches, the map is only the starting point. Residents are urged to consult local weather offices, monitor municipal emergency alerts, and proactively identify their personal vulnerability to hazards like flooding and wind.
The science of forecasting is, in the words of the researchers, "excellent." The challenge now lies in bridging the gap between the screen and the household, ensuring that when the next storm approaches, the public is not just watching the map, but preparing for the reality it depicts.


 Laily UPN

 Nana Muazin

 Reynand Wu

 Sagoh
 Azzam Bilal Chamdy

 Ali Ikhwan
