
 Nana Wu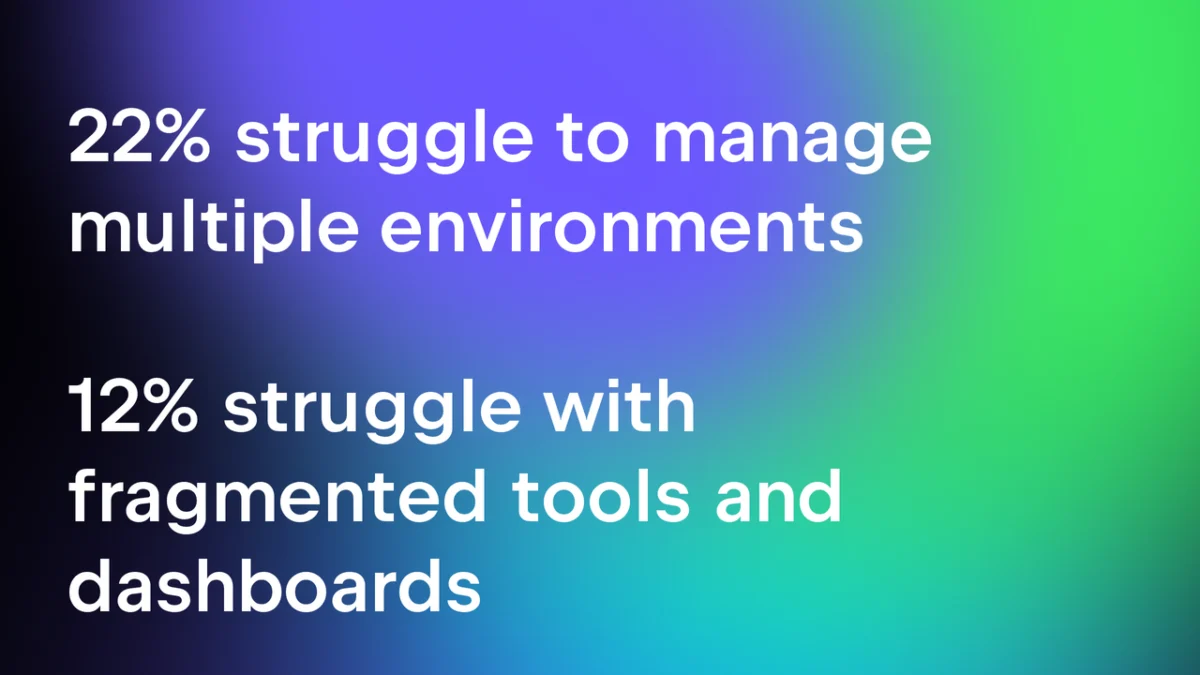
In the modern software development lifecycle, the CI/CD pipeline serves as the heartbeat of delivery. However, when that heartbeat becomes erratic—characterized by mysterious delays, intermittent failures, or resource bottlenecks—the ability to diagnose the root cause is often the difference between a minor inconvenience and a major production incident. As pipelines grow increasingly sophisticated, the challenge of maintaining "observability" has moved from a niche requirement to a mission-critical competency for DevOps-centric teams.
The Challenge of Complexity: Why Pipelines Fail
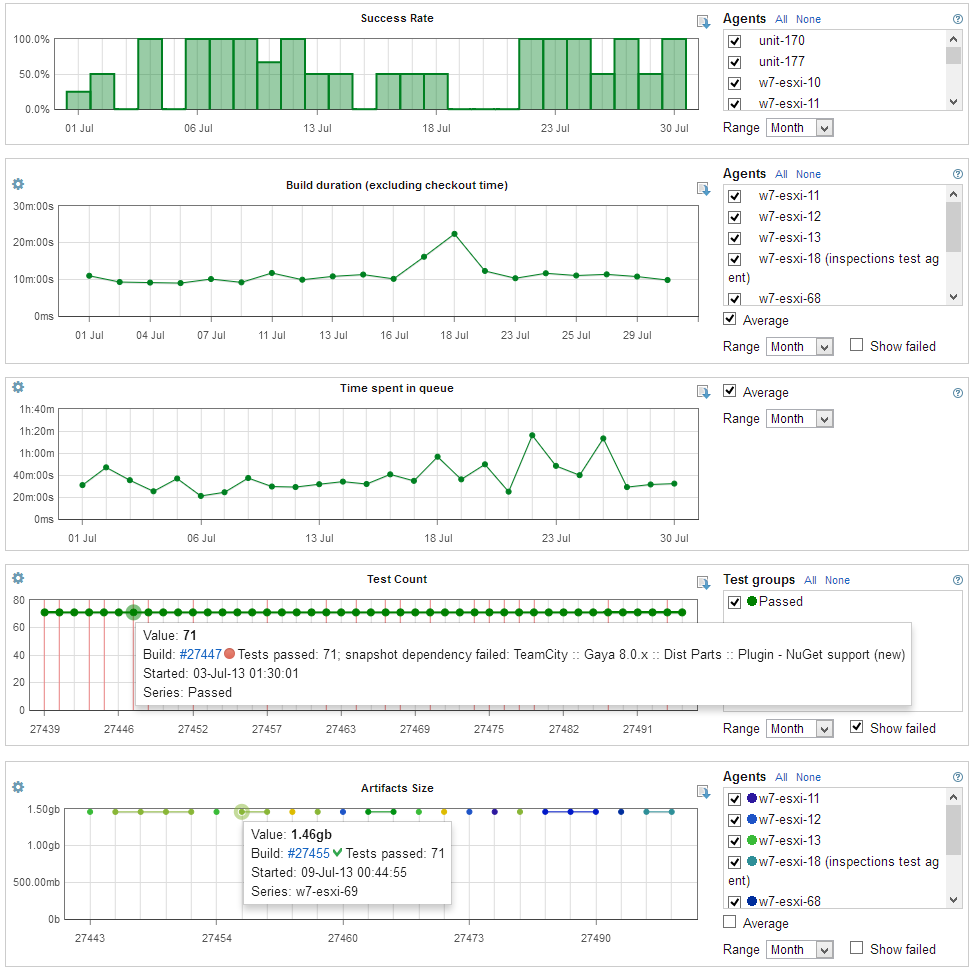
When a CI/CD pipeline fails, the dashboard is typically the first point of contact. While it may indicate that a process failed, it frequently leaves engineers guessing as to why. Was it a genuine regression in the codebase? A flaky unit test that surfaces only under specific load? Or perhaps an overloaded build agent struggling with memory constraints?
The complexity arises because a modern pipeline is not a monolithic entity; it is a distributed ecosystem. A single deployment touches version control systems, ephemeral build agents, container orchestration layers, complex test suites, artifact repositories, security scanning tools, and cloud deployment targets. Each of these components generates its own telemetry. The friction arises when teams must manually correlate this fragmented data—logs from a container, metrics from a cloud provider, and status codes from a build agent—to reconstruct a coherent narrative of what transpired.
Supporting Data: The 2026 Ecosystem Snapshot
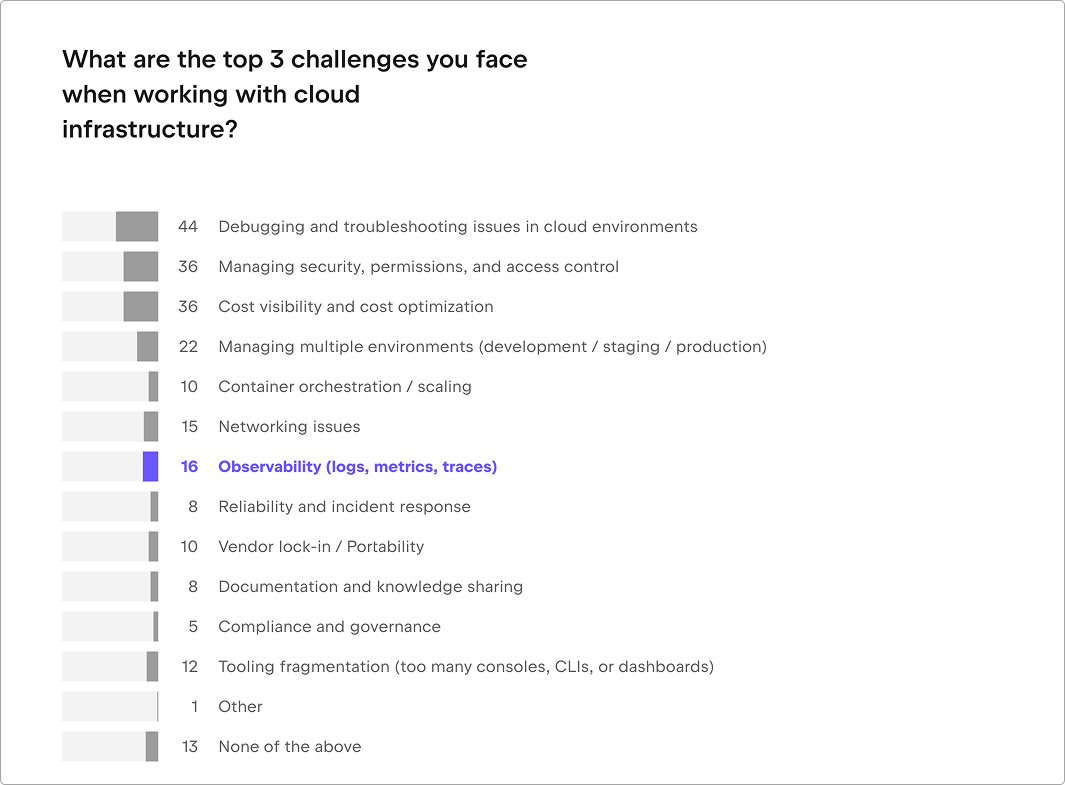
According to the JetBrains Developer Ecosystem Survey 2026, this friction is a universal pain point. In a survey of 20,416 software professionals, debugging and troubleshooting issues within cloud-native environments emerged as the primary challenge for 44% of respondents.
The data further highlights the fractured nature of modern tooling:
- 36% of respondents identify security and access control as a major hurdle.
- 36% struggle with cost visibility and resource optimization.
- 16% specifically cite a lack of observability as a top-three challenge.
- 12% of developers point to the "dashboard fatigue" caused by juggling too many disparate tools and consoles.
These statistics confirm that the industry is hitting a ceiling where simply "monitoring" (tracking known metrics) is no longer sufficient. Teams require true "observability"—the ability to explore the internal state of a system based on its external outputs—to navigate the complexities of their delivery infrastructure.

Defining CI/CD Pipeline Observability
To effectively manage these systems, one must distinguish between monitoring and observability. Monitoring is reactive; it tracks known conditions against predefined thresholds (e.g., "Alert me if build duration exceeds 20 minutes"). It is essential for uptime but limited in scope.
Observability is investigative. It provides the connected data required to interrogate systems when an unexpected failure occurs. It allows an engineer to trace a spike in build duration back to a specific commit, a change in test suite configuration, or an underperforming agent pool, without having to wait for the issue to recur.
Key Metrics for a Healthier Pipeline
For an observability strategy to be effective, it must track signals at two distinct levels:
- Pipeline-Level Metrics: These track the developer experience. Key indicators include queue time, total pipeline duration, stage-by-stage latency, and, critically, failure and retry rates. When analyzing duration, teams should prioritize percentiles (P95/P99) over averages, as averages often mask the pain experienced by developers waiting on the slowest 10% of builds.
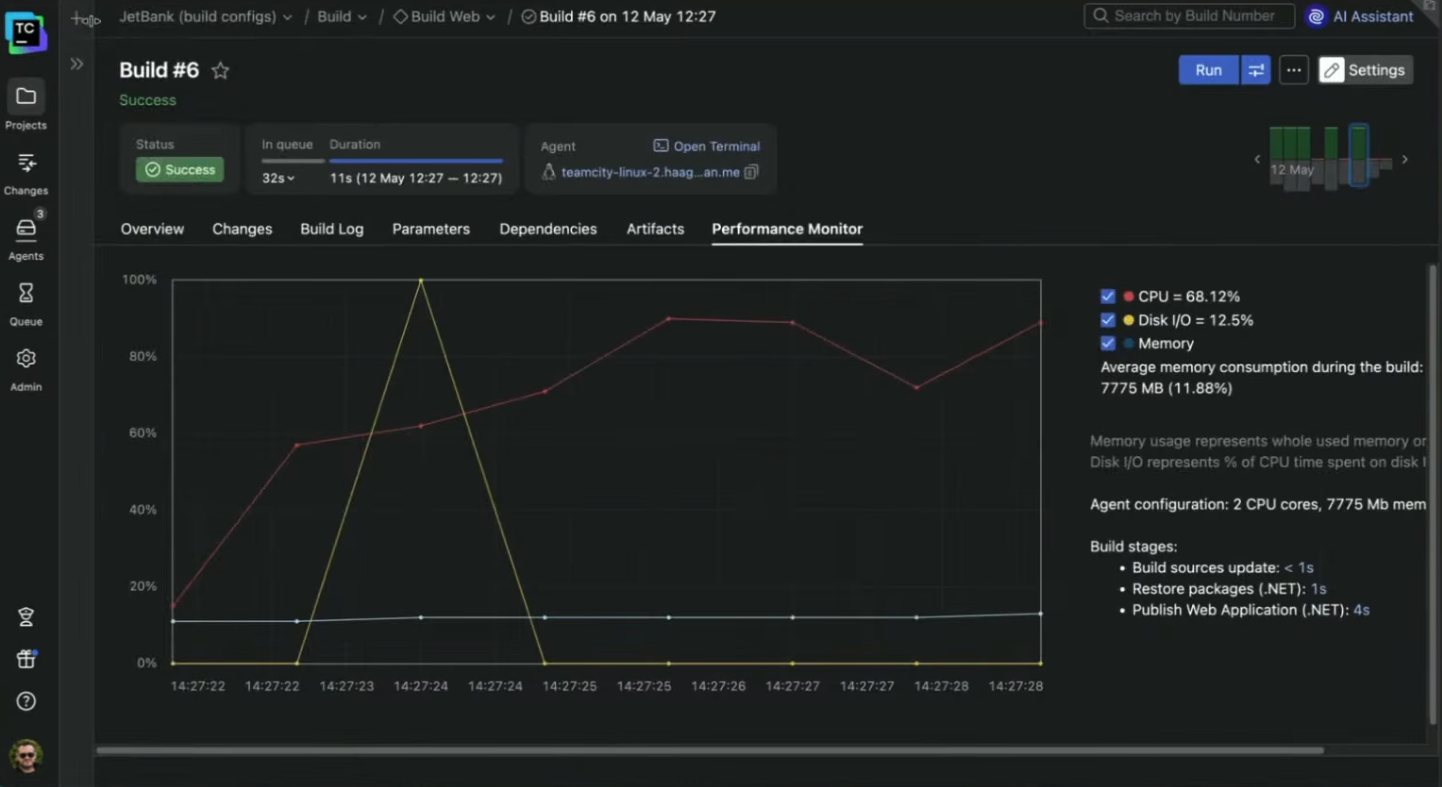
- Platform-Level Metrics: These track the "machinery" of the build. This includes agent utilization, CPU/memory consumption, disk I/O, and the availability of external dependencies. Distinguishing between a code-level failure and an infrastructure-level bottleneck is impossible without this context.
The Evolution of Observability Tooling
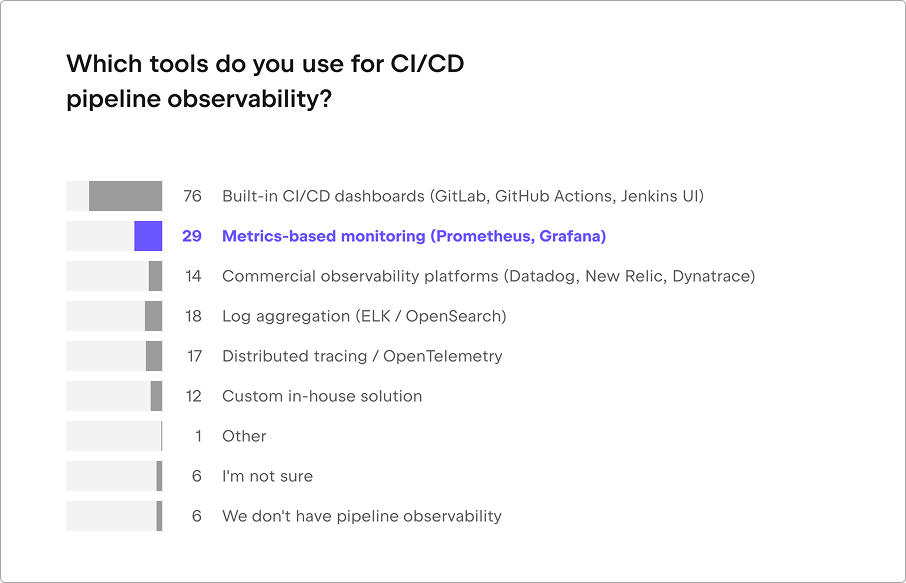
The State of Developer Ecosystem Survey 2026 reveals that while 76% of teams rely on built-in CI/CD dashboards as their primary observability layer, few rely on them exclusively. The landscape has evolved into a multi-layered stack:
- Built-in Dashboards: These remain the standard for immediate, contextual debugging. They excel because they understand the relationship between a commit, a build, and an artifact.
- Metrics-Centric Tools (Prometheus/Grafana): Used by 29% of respondents, these are the gold standard for infrastructure health.
- Log Aggregation (Elastic/OpenSearch): Utilized by 18% of teams, these are indispensable for deep-dive investigations into the "why" behind an error.
- OpenTelemetry: Representing 17% of usage, this standard is gaining ground as the vendor-neutral glue that stitches telemetry data across heterogeneous systems.
Choosing the Right Framework
For engineering leaders evaluating their observability strategy, five criteria should guide the selection process:
1. Investigation Depth and Context
An observability tool is only as good as its ability to maintain context. If a tool reports a "failed build" but cannot link that failure to the specific Git branch, the pull request author, and the underlying build agent logs, it is merely a notification system, not an observability tool.
2. Correlation Across Systems
A bottleneck in a CI/CD pipeline is rarely confined to the CI server. It often involves a latent database connection or an unresponsive artifact repository. A superior tool must correlate data across the entire toolchain, preventing the "swivel-chair" effect of switching between five different browser tabs to resolve a single incident.
3. Setup and Usability
The "Time to Insight" is critical. If a tool is so complex that it requires a dedicated SRE team to maintain the dashboards, it will likely be ignored by the developers who need it most. Built-in features, such as those provided by modern platforms like TeamCity, often provide the best balance of "out-of-the-box" value versus custom configuration.
4. Security and Data Governance
Because CI/CD logs often contain sensitive environment variables, secrets, and repository metadata, data residency and access control are not optional. Before adopting an external SaaS solution, teams must audit where data is stored, how it is encrypted, and who has the permissions to view logs that may contain production-sensitive information.
5. Cost and Portability
Subscription fees are only the tip of the iceberg. The "hidden" costs—data ingestion fees, the engineering hours required for maintenance, and the risk of vendor lock-in—must be calculated. Open standards like OpenTelemetry provide a hedge against lock-in, ensuring that if a team outgrows a specific tool, their instrumentation remains valuable.
Implications for the Future
The move toward better pipeline observability is a shift toward a more mature DevOps culture. It acknowledges that software delivery is not a "fire and forget" process, but a continuous loop of development, deployment, and feedback.
For organizations struggling with these challenges, the path forward is clear:
- Start with the "Why": Identify the questions your current dashboards cannot answer. Are you losing time to flaky tests? Is infrastructure cost ballooning?
- Leverage Context: Prioritize tools that preserve the relationship between pipeline events and underlying infrastructure.
- Standardize Collection: Use OpenTelemetry to normalize data collection, allowing for flexibility in the backend systems you use for analysis.
- Iterate: Do not attempt to build a "perfect" observability stack in one sprint. Add instrumentation where it provides the highest ROI for developer productivity.
Final Thoughts
Effective pipeline observability is ultimately about reducing cognitive load. By transforming raw logs and disparate metrics into a unified view of the delivery process, teams can spend less time chasing ghosts in their CI/CD systems and more time shipping value. Whether through a robust, built-in dashboard or a sophisticated, multi-tool observability suite, the goal remains the same: visibility that leads to faster, more confident, and more reliable software delivery.


 Asro
Asro
 Jia Lissa

 Neng Nana
 Dwi Wanna
 Siti Muinah