
 Pevita Pearce
Introduction
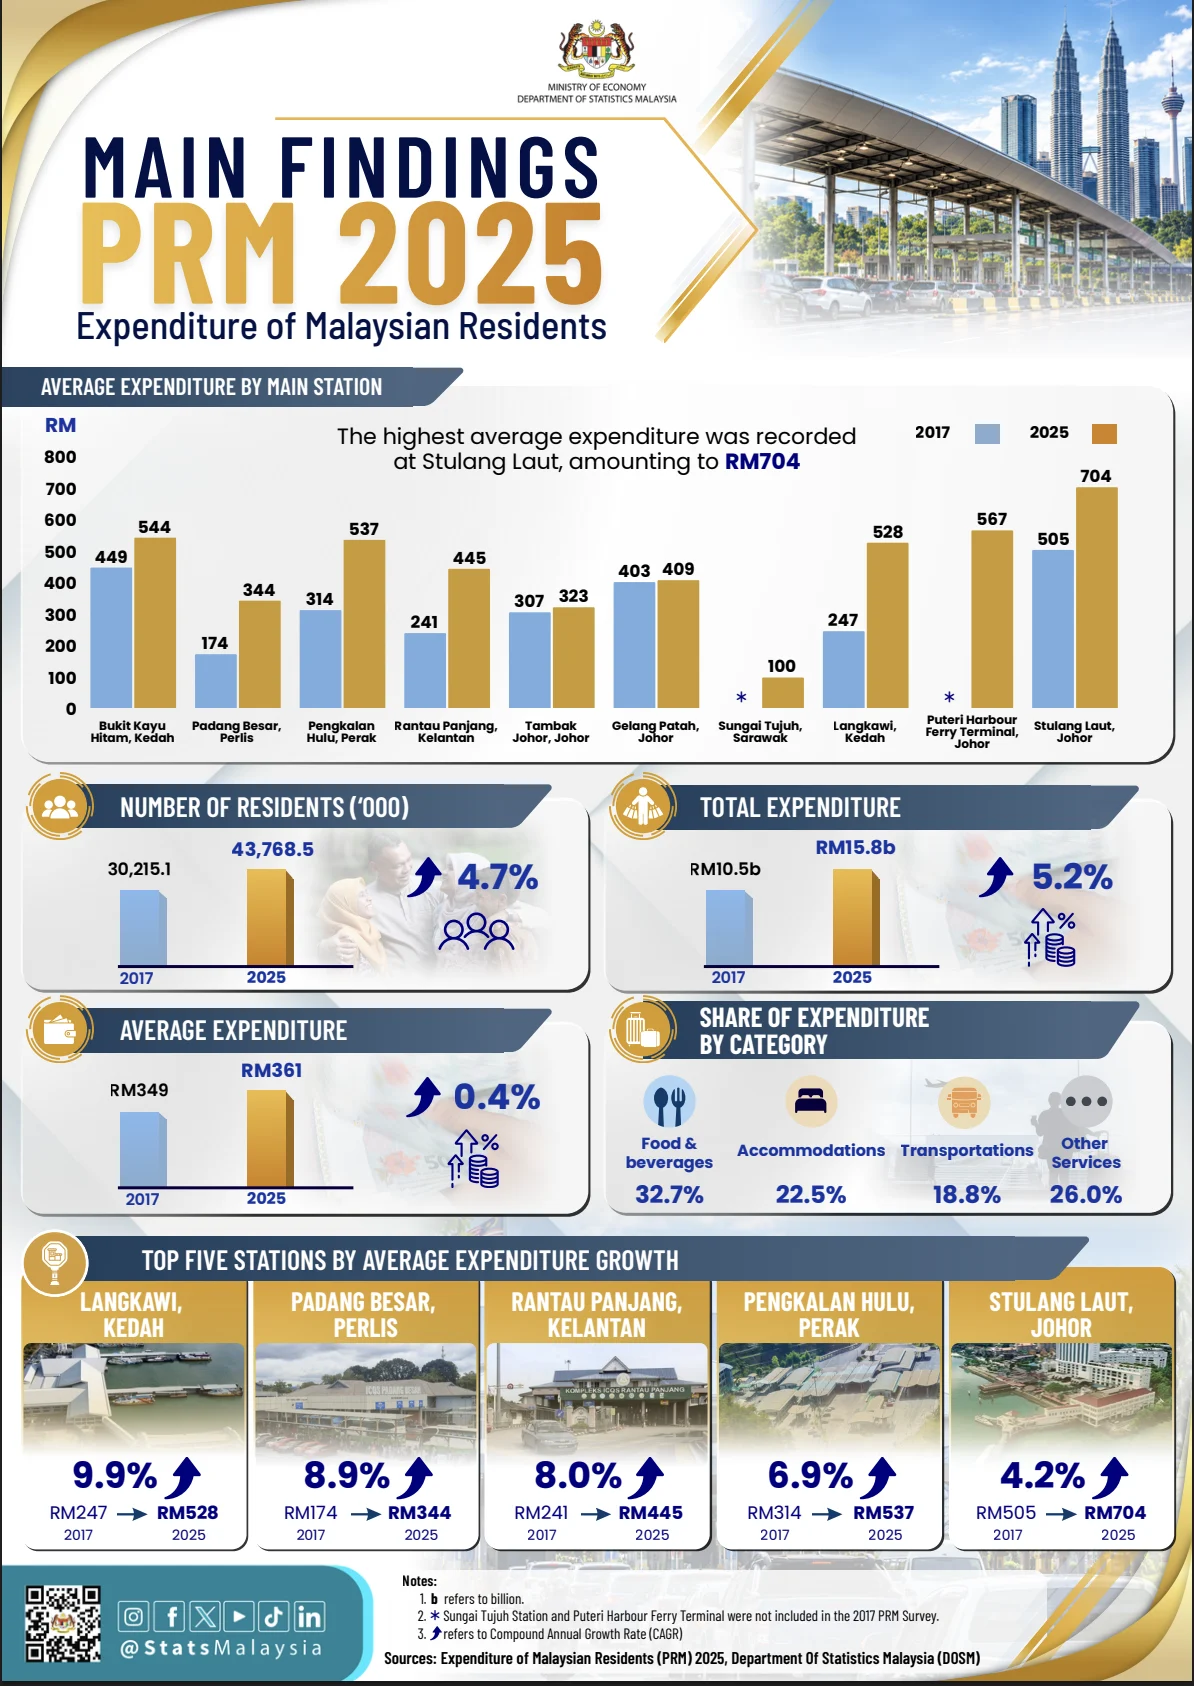
In an era of increasing regional integration and evolving consumer habits, the mobility of Malaysian residents across national borders has become a significant pillar of the regional economy. According to the latest Expenditure of Malaysian Residents Survey Report (PRM) 2025 released by the Department of Statistics Malaysia (DOSM), Malaysian residents spent a staggering RM15.8 billion in neighboring border towns throughout the year.
This figure highlights a robust appetite for cross-border consumption, with food and beverages (F&B) emerging as the primary driver of expenditure. Accounting for nearly a third of the total spend, the F&B sector underscores the cultural and economic ties that bind Malaysia to its neighbors—specifically Singapore, Thailand, Indonesia, and Brunei Darussalam. As the first comprehensive survey of its kind since 2017, the 2025 report offers a granular look at how, where, and why Malaysians are spending their money abroad, providing vital data for the nation’s Balance of Payments.
1. Main Facts: A Macro View of Cross-Border Spending
The headline figure of RM15.8 billion represents a significant leap from the RM10.5 billion recorded in the 2017 survey. This growth reflects a compound annual growth rate (CAGR) of 5.2% over the eight-year period. While the total expenditure saw a sharp rise, the average expenditure per person saw a more modest increase, moving from RM349 in 2017 to RM361 in 2025—a growth of 0.4% per annum.
The distribution of this wealth is heavily concentrated geographically. Singapore remains the dominant destination for Malaysian cross-border spending, accounting for an overwhelming 86.7% of the total expenditure. This is largely facilitated by the high-volume crossings in Johor. The Tambak Johor (Causeway) alone recorded RM8.5 billion (53.8% of the total), while Gelang Patah (Second Link) accounted for RM5.2 billion (32.8%).
Key Spending Categories:
- Food & Beverages: 32.7% (RM5.17 billion)
- Accommodation: 22.5% (RM3.56 billion)
- Transport: 18.8% (RM2.97 billion)
- Shopping: 17.3% (RM2.73 billion)
- Entertainment: 7.5% (RM1.19 billion)
- Others (Medical, Tours, etc.): 1.3% (RM0.21 billion)
The data suggests that while shopping and entertainment are significant, the "bread and butter" of cross-border activity remains the basic necessities of travel: eating, sleeping, and moving.
2. Chronology and Survey Context: The Evolution of the PRM
The Expenditure of Malaysian Residents Survey Report (PRM) is a quinquennial exercise, conducted every five years to capture the shifting dynamics of land and sea travel. The 2025 report is particularly significant as it marks the full stabilization of cross-border movement following the disruptions of the early 2020s.
The 2025 survey was expanded in scope compared to 2017. It covered 10 strategic immigration entry points across six Malaysian states:
- Johor: Tambak Johor, Gelang Patah, Puteri Harbour Ferry Terminal, and Stulang Laut.
- Kedah: Bukit Kayu Hitam and Langkawi.
- Kelantan: Rantau Panjang.
- Perak: Pengkalan Hulu.
- Perlis: Padang Besar.
- Sarawak: Sungai Tujuh (a new addition for the 2025 cycle).
By expanding the survey to include new stations like Sungai Tujuh on the Brunei border and refining the "Purpose of Visit" categories, DOSM has provided a more nuanced dataset. The survey now tracks five distinct motivations for travel: work, tourism, visiting family, business, and transit. This chronological evolution of the survey methodology allows policymakers to distinguish between the "commuter economy" of the Johor-Singapore corridor and the "leisure economy" of the Thai and Indonesian borders.
3. Supporting Data: Breaking Down the Logistics of Spending
The Dominance of Land Routes
The report confirms that the vast majority of cross-border spending occurs via land. Land routes accounted for RM15.6 billion, or 98.8% of total expenditure.

- Buses: The most popular mode for total volume, contributing RM7.7 billion (48.9%).
- Cars: Accounted for RM6.2 billion (39.3%), but notably held the highest average expenditure per person at RM460.
- Motorcycles: Contributed RM1.6 billion (9.8%), though with a much lower average spend of RM124, reflecting the daily worker commute.
- Trains: Represented a niche 0.8% of the spend.
Sea routes, though representing only 1.2% of the total (RM0.2 billion), saw the highest per-capita spending. Ferry passengers spent an average of RM650 per person, likely due to the nature of ferry travel often being associated with leisure trips to Indonesia (Batam/Bintan) or Langkawi-Thailand routes.
Overnight vs. Day Trippers
Duration of stay is a primary determinant of expenditure. Overnight visitors, who make up the backbone of the border economy, accounted for 85.8% of total spending (RM13.5 billion). Their average spend was RM427.
In contrast, day trippers—those staying less than 24 hours—contributed 14.2% of the total, with an average spend of RM187. Interestingly, Puteri Harbour recorded the highest day-tripper average at RM387, suggesting that those using the ferry terminal for short trips are generally higher-spending consumers.
The Payment Revolution: Cash vs. Digital
Despite the global shift toward digitalization, cash remains the king of the border. 59.6% of all transactions (RM9.4 billion) were conducted in cash. However, cashless payments have secured a significant foothold, accounting for 40.4% (RM6.4 billion).
- Tambak Johor led in both categories, with RM4.8 billion in cash and RM3.7 billion in cashless transactions.
- The high volume of cashless payments at the Singapore checkpoints reflects the advanced digital payment infrastructure integrated between Malaysia and Singapore (such as the QR code payment linkages).
Regional Highlights and Anomalies
- Stulang Laut: Recorded the highest average expenditure at RM704 per resident. This is attributed to its role as a gateway for business and tourism to Indonesia.
- Langkawi: Showed the most aggressive growth in average expenditure, jumping from RM247 in 2017 to RM528 in 2025—a 9.9% annual increase.
- Pengkalan Hulu: Stood out as a unique case where entertainment was the largest spending category (38.4%), differing from the F&B-heavy profile of other stations.
4. Official Responses and Institutional Framework
The Department of Statistics Malaysia (DOSM) emphasized that the PRM 2025 serves as a critical instrument for national accounting. Chief Statistician Dato’ Sri Dr. Mohd Uzir Mahidin has previously highlighted that such surveys are essential for calculating the "Travel" component within the Balance of Payments (BOP).
By tracking the outflow of Ringgit into neighboring border towns, the government can better understand the "leakage" of domestic consumption and the reciprocal "injection" of services. The data from Tambak Johor and Gelang Patah, where a large percentage of residents travel for work (77.0% and 65.1% respectively), provides the government with insights into the "shadow economy" of commuters who live in Malaysia but consume services in Singapore.
The inclusion of five specific visit purposes (Work, Tourism, Family, Business, Transit) allows for more targeted infrastructure planning. For instance, the high average expenditure for business purposes at Stulang Laut (RM914) and tourism at Tambak Johor (RM881) provides a clear signal to the Ministry of Transport and the Ministry of Tourism regarding where to prioritize facility upgrades.
5. Implications: What These Numbers Mean for Malaysia’s Future
The findings of the PRM 2025 carry significant implications for Malaysia’s economic and social policy moving forward.
The Johor-Singapore Special Economic Zone (JS-SEZ)
The fact that 86.7% of expenditure flows toward Singapore underscores the critical importance of the Johor-Singapore relationship. The high spending on F&B, transport, and accommodation by commuters suggests a deeply integrated "cross-border lifestyle." As Malaysia and Singapore move toward the realization of the Johor-Singapore Special Economic Zone (JS-SEZ), these spending patterns will likely intensify. The high volume of cash transactions also suggests that there is still room for further integration of fintech solutions to capture more data and provide convenience for the hundreds of thousands of daily commuters.
Economic Leakage vs. Opportunity
While RM15.8 billion leaving the country might be viewed as economic leakage, it also represents a symbiotic relationship. The 5.2% annual growth in spending indicates a rising middle class with disposable income. However, the dominance of F&B and Shopping in Thailand-border towns like Bukit Kayu Hitam (where shopping makes up 26.7% of spend) suggests that Malaysian retailers in border states like Kedah and Kelantan face stiff competition from their neighbors.
The "Length of Stay" Factor
The data clearly shows a correlation between stay duration and economic contribution:
- 1 Night: RM191
- 3 Nights: RM933
- Over 1 Week: RM2,703
This progression suggests that to maximize the "Travel" credit in the Balance of Payments, there is a need for reciprocal tourism strategies that encourage neighboring residents to stay longer in Malaysia, just as Malaysians are doing abroad.
Conclusion: A Journey-Driven Economy
Ultimately, the PRM 2025 reveals that Malaysian cross-border spending is less about the destination and more about the nature of the journey. Whether it is the pragmatic spend of a daily worker at the Causeway or the indulgent leisure spend at a Thai border town, food remains the universal denominator.
As Malaysia looks toward 2030, these figures will serve as a roadmap for infrastructure development, digital payment integration, and bilateral trade negotiations. The RM15.8 billion spent abroad is not just a statistic; it is a testament to the fluid, interconnected reality of life on the Malay Peninsula and across the waters to Indonesia and Brunei. For businesses and policymakers alike, the message is clear: the border is not a wall, but a bustling marketplace that continues to grow in value and complexity.


 Nana

 Dwi Wanna

 Asep Darmawan

 Layla Zulfa

 Suro Senen

 Evan Lee Salim
