
 Lina Hope

For the modern founder, the email marketing dashboard is a paradox. It is a portal to deep customer insights, yet for many, it functions as a digital hall of mirrors. You log in, you see a flurry of percentages—open rates, bounce rates, click-through rates—and you are left with a binary feeling: either everything is "fine," or something is "wrong."
Most founders spend less than ten minutes a month auditing these figures before pivoting back to the immediate fires of daily operations. However, this casual approach to data is leaving massive revenue on the table. To transform your email program from a guessing game into a high-performance engine, you must stop "watching" your metrics and start interrogating them.
The Evolution of Email Metrics: A Chronology of Change
To understand why your dashboard feels disconnected from reality, we must look at the history of how these metrics have evolved.
In the early 2010s, email marketing was governed by "vanity metrics." The open rate was the undisputed king. It was a reliable proxy for how many people were interested in your brand. If your open rate was 30%, you assumed 30% of your list was engaging with your message.
That reality shifted violently in 2021. With the introduction of Apple’s Mail Privacy Protection (MPP), the landscape changed overnight. Apple began pre-loading emails on devices, which registered as "opens" regardless of whether the user actually engaged with the content. Suddenly, industry-wide open rates spiked, effectively turning the "open rate" into a noisy, unreliable metric.
Today, we are in the era of "Revenue-Centric Analytics." The focus has shifted from mere engagement to tangible, bottom-line impact. In 2026, the most successful brands are no longer asking, "Did they see it?" They are asking, "Did it drive a sale?"
Supporting Data: Decoding the Hierarchy of Metrics
Not all data points are created equal. To build a robust strategy, you must categorize your metrics into three tiers: The Truth, The Diagnostics, and The Smoke Detectors.
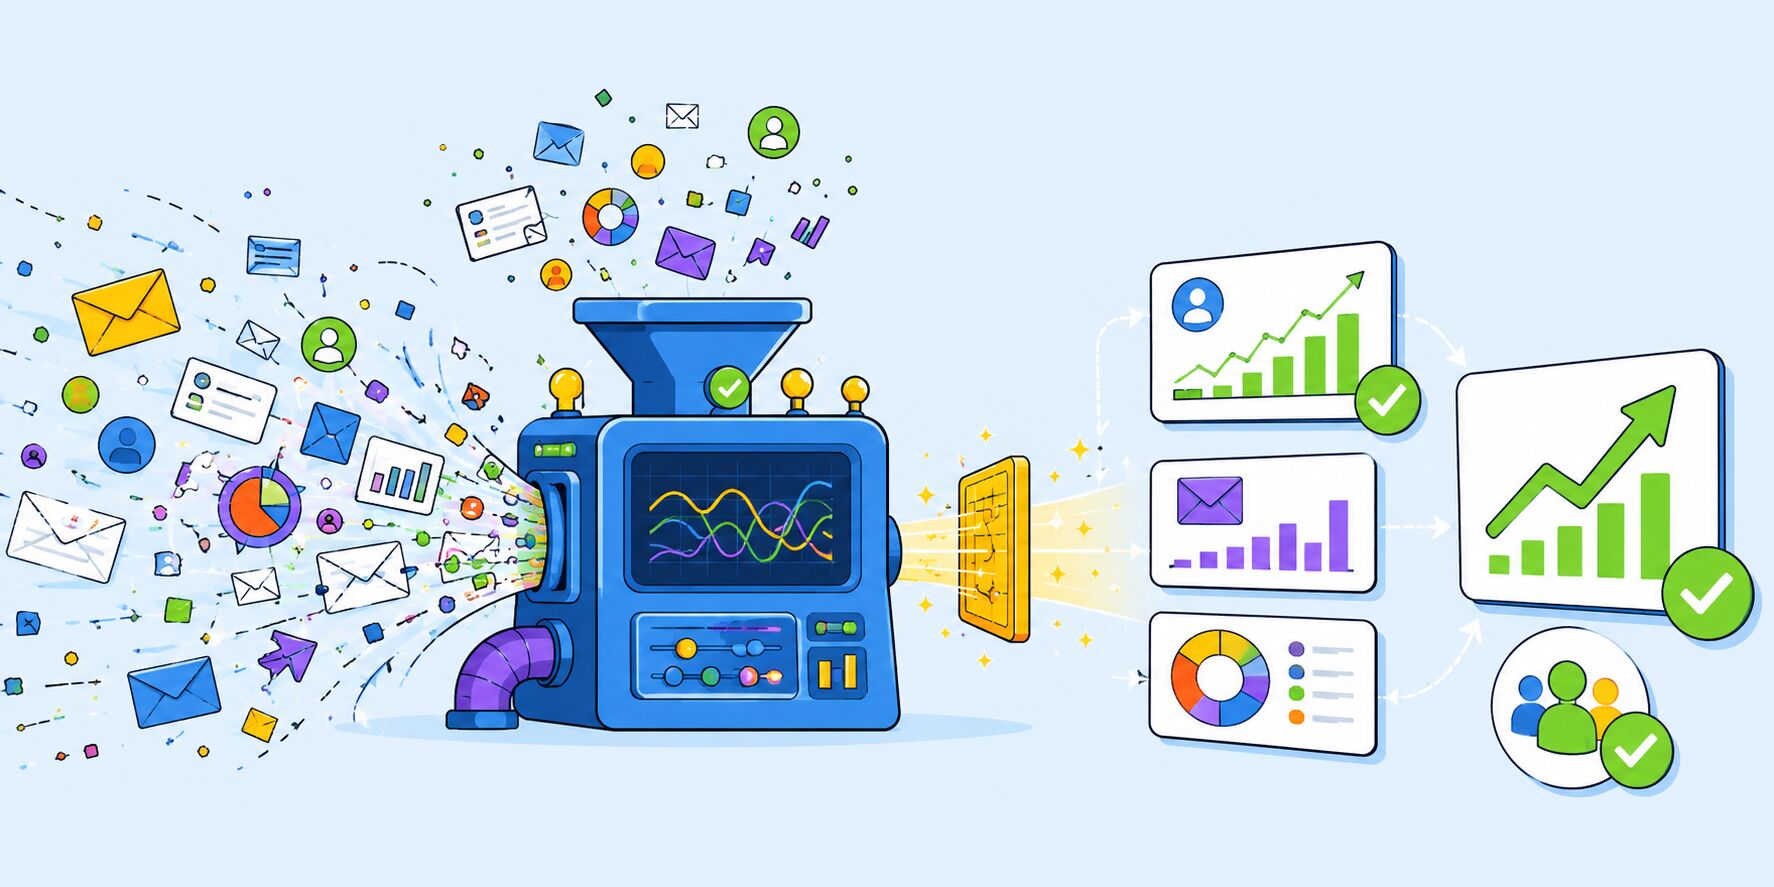
1. The Truth: Click Rates and Revenue
The most honest metric in your arsenal is the Click-Through Rate (CTR). Unlike open rates, a click cannot be faked by a privacy algorithm. A user must intentionally engage with your content.
- Click-to-Open Rate (CTOR): This is your primary diagnostic tool. By comparing your clicks to your opens, you can identify exactly where your funnel is failing. If you have a high open rate but a dismal CTOR, your subject line is writing checks your content can’t cash. You have successfully baited the click, but failed to deliver the value.
- Revenue Per Email (RPE): This is the ultimate "grown-up" metric. It strips away the vanity of engagement and focuses on the reality of conversion. By calculating the total revenue generated by a campaign divided by the number of emails delivered, you can compare the effectiveness of a high-effort newsletter against a simple, automated abandoned-cart sequence.
2. The Diagnostics: Segment-Level Insights
Modern analytics allow for a level of granularity that was unthinkable a decade ago. It is no longer enough to look at your list as a monolith. You must examine:
- Segment Performance: Are your VIPs interacting differently than your new leads?
- Automation vs. Campaign Split: If 80% of your revenue is coming from one-off campaigns and only 20% from automations, your business is operating in "hustle mode" rather than "system mode." The most scalable brands flip this ratio, relying on high-converting, evergreen flows to do the heavy lifting.
3. The Smoke Detectors: Health and Hygiene
These are the metrics you ignore until you can’t.
- Hard Bounce Rate: A rising bounce rate is a direct signal to inbox providers (like Google or Yahoo) that your list is decaying or poorly sourced. Keep this below 1%.
- Spam Complaints: The "silent killer." Even a marginal increase here can land your domain on a blacklist, ensuring your future emails never reach the inbox.
- Unsubscribe Rates: Contrary to popular belief, a 0% unsubscribe rate is a red flag. It often suggests your unsubscribe link is hidden, leading frustrated users to mark your email as "spam" instead of simply opting out. A steady, low-level churn (0.2%–0.5%) is actually a healthy sign of list maintenance.
The Strategic Implications for Founders
What does this data mean for your business operations? The implications are threefold:
The "One-Change" Methodology
The most common failure in data analysis is the "paralysis of insight." Many founders look at a bad report and try to change everything at once. This makes it impossible to know what actually improved performance.
The most efficient strategy is the Fifteen-Minute Monthly Ritual. Spend fifteen minutes once a month answering four specific questions:
- Which campaign yielded the highest revenue per email, and why?
- Which automation is underperforming relative to its potential?
- What is the trend line for our unsubscribe and spam complaint rates?
- What is the one thing we will change in the next 30 days to optimize these results?
The Shift Toward Automated Infrastructure
The data suggests that the "manual campaign" era is waning. Automated flows—welcome series, post-purchase sequences, and win-back campaigns—consistently outperform broadcast emails because they meet the customer at the moment of highest intent. If your data shows your automations are contributing only a sliver of your total revenue, you have identified your biggest growth opportunity.

Leveraging Professional Tooling
As the sophistication of email analytics increases, so does the need for tools that do the heavy lifting. Platforms like Omnisend have moved beyond simple email sending to become true revenue-attribution engines. By tying every campaign and automation directly to a dollar amount, they allow founders to move from "spreadsheet archaeology" to actionable decision-making.
For many businesses, the barrier to entry for better analytics is the fear of migration. However, modern migration services have made this transition seamless, often moving full templates, lists, and flows in under a week.
Final Thoughts: The Dashboard is a Dialogue
Your email dashboard is not a scoreboard; it is a conversation. If you look at your metrics and see only numbers, you are missing the point. You are looking at human behavior, intent, and relationship equity.
The next time you open your analytics, don’t just glance at the percentages. Argue with them. Ask why the CTR dropped on Tuesday. Ask why your welcome flow is outperforming your promotional blasts. Ask if your list is actually growing in value or just in volume.
By adopting this disciplined, data-driven approach, you stop being a passive observer of your email marketing and start being its architect. You move from sending emails to steering a business, one informed, intentional change at a time.
Foundr readers can take advantage of this transition by using code FOUNDR50 for 50% off their first three months with Omnisend, turning their analytics from a source of stress into a competitive advantage.


 Nila Kartika Wati

 Asep Darmawan

 Ammar Sabilarrohman


 Asro

 Layla Zulfa
 Muslim
